Bank of America 2007 Annual Report Download - page 43
Download and view the complete annual report
Please find page 43 of the 2007 Bank of America annual report below. You can navigate through the pages in the report by either clicking on the pages listed below, or by using the keyword search tool below to find specific information within the annual report.-
 1
1 -
2
-
3
-
4
-
5
-
6
-
7
-
8
-
9
-
10
-
11
-
12
-
13
-
14
-
15
-
16
-
17
-
18
-
19
-
20
-
21
-
22
-
23
-
24
-
25
-
26
-
27
-
28
-
29
-
30
-
31
-
32
-
 33
33 -
 34
34 -
 35
35 -
 36
36 -
 37
37 -
 38
38 -
 39
39 -
 40
40 -
 41
41 -
 42
42 -
 43
43 -
 44
44 -
 45
45 -
 46
46 -
 47
47 -
 48
48 -
 49
49 -
 50
50 -
 51
51 -
 52
52 -
 53
53 -
54
-
55
-
56
-
57
-
58
-
59
-
60
-
61
-
62
-
63
-
64
-
65
-
66
-
67
-
68
-
69
-
70
-
71
-
72
-
73
-
74
-
75
-
76
-
77
-
78
-
79
-
80
-
81
-
82
-
83
-
84
-
85
-
86
-
87
-
88
-
89
-
90
-
91
-
92
-
93
-
94
-
95
-
96
-
97
-
98
-
99
-
100
-
101
-
102
-
103
-
104
-
105
-
106
-
107
-
108
-
109
-
110
-
111
-
112
-
113
-
114
-
115
-
116
-
117
-
118
-
119
-
120
-
121
-
122
-
123
-
124
-
125
-
126
-
127
-
128
-
129
-
130
-
131
-
132
-
133
-
134
-
135
-
136
-
137
-
138
-
139
-
140
-
141
-
142
-
143
-
144
-
145
-
146
-
147
-
148
-
149
-
150
-
151
-
152
-
153
-
154
-
155
-
156
-
157
-
158
-
159
-
160
-
161
-
162
-
163
-
164
-
165
-
166
-
167
-
168
-
169
-
170
-
171
-
172
-
173
-
174
-
175
-
176
-
177
-
178
-
179
 |
 |

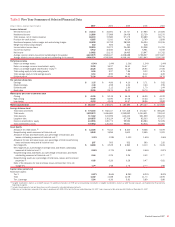
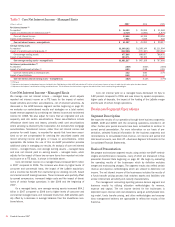
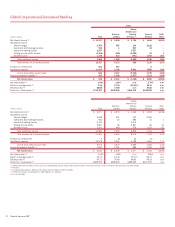
Table 5 Five Year Summary of Selected Financial Data
(Dollars in millions, except per share information) 2007 2006 2005 2004 2003
Income statement
Net interest income
$ 34,433
$ 34,591 $ 30,737 $ 27,960 $ 20,505
Noninterest income
31,886
37,989 26,438 22,729 18,270
Total revenue, net of interest expense
66,319
72,580 57,175 50,689 38,775
Provision for credit losses
8,385
5,010 4,014 2,769 2,839
Noninterest expense, before merger and restructuring charges
36,600
34,792 28,269 26,394 20,155
Merger and restructuring charges
410
805 412 618 –
Income before income taxes
20,924
31,973 24,480 20,908 15,781
Income tax expense
5,942
10,840 8,015 6,961 5,019
Net income
14,982
21,133 16,465 13,947 10,762
Average common shares issued and outstanding (in thousands)
4,423,579
4,526,637 4,008,688 3,758,507 2,973,407
Average diluted common shares issued and outstanding (in thousands)
4,480,254
4,595,896 4,068,140 3,823,943 3,030,356
Performance ratios
Return on average assets
0.94%
1.44% 1.30% 1.34% 1.44%
Return on average common shareholders’ equity
11.08
16.27 16.51 16.47 21.50
Return on average tangible shareholders’ equity
(1)
22.25
32.80 30.19 28.93 27.84
Total ending equity to total ending assets
8.56
9.27 7.86 9.03 6.76
Total average equity to total average assets
8.53
8.90 7.86 8.12 6.69
Dividend payout
72.26
45.66 46.61 46.31 39.76
Per common share data
Earnings
$ 3.35
$ 4.66 $ 4.10 $ 3.71 $ 3.62
Diluted earnings
3.30
4.59 4.04 3.64 3.55
Dividends paid
2.40
2.12 1.90 1.70 1.44
Book value
32.09
29.70 25.32 24.70 16.86
Market price per share of common stock
Closing
$ 41.26
$ 53.39 $ 46.15 $ 46.99 $ 40.22
High closing
54.05
54.90 47.08 47.44 41.77
Low closing
41.10
43.09 41.57 38.96 32.82
Market capitalization
$ 183,107
$ 238,021 $ 184,586 $ 190,147 $ 115,926
Average balance sheet
Total loans and leases
$ 776,154
$ 652,417 $ 537,218 $ 472,617 $ 356,220
Total assets
1,602,073
1,466,681 1,269,892 1,044,631 749,104
Total deposits
717,182
672,995 632,432 551,559 406,233
Long-term debt
169,855
130,124 97,709 92,303 67,077
Common shareholders’ equity
133,555
129,773 99,590 84,584 50,035
Total shareholders’ equity
136,662
130,463 99,861 84,815 50,091
Asset Quality
Allowance for credit losses
(2)
$ 12,106
$ 9,413 $ 8,440 $ 9,028 $ 6,579
Nonperforming assets measured at historical cost
5,948
1,856 1,603 2,455 3,021
Allowance for loan and lease losses as a percentage of total loans and
leases outstanding measured at historical cost
(3)
1.33%
1.28% 1.40% 1.65% 1.66%
Allowance for loan and lease losses as a percentage of total nonperforming
loans and leases measured at historical cost
207
505 532 390 215
Net charge-offs
$ 6,480
$ 4,539 $ 4,562 $ 3,113 $ 3,106
Net charge-offs as a percentage of average loans and leases outstanding
measured at historical cost
(3)
0.84%
0.70% 0.85% 0.66% 0.87%
Nonperforming loans and leases as a percentage of total loans and leases
outstanding measured at historical cost
(3)
0.64
0.25 0.26 0.42 0.77
Nonperforming assets as a percentage of total loans, leases and foreclosed
properties
(3)
0.68
0.26 0.28 0.47 0.81
Ratio of the allowance for loan and lease losses at December 31 to net
charge-offs
1.79
1.99 1.76 2.77 1.98
Capital ratios (period end)
Risk-based capital:
Tier 1
6.87%
8.64% 8.25% 8.20% 8.02%
Total
11.02
11.88 11.08 11.73 12.05
Tier 1 Leverage
5.04
6.36 5.91 5.89 5.86
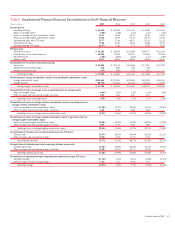
(1) Tangible shareholders’ equity is a non-GAAP measure. For additional information on ROTE and a corresponding reconciliation of tangible shareholders’ equity to a GAAP financial measure, see Supplemental Financial Data
beginning on page 42.
(2) Includes the allowance for loan and lease losses, and the reserve for unfunded lending commitments.
(3) Ratios do not include loans measured at fair value in accordance with SFAS 159 at and for the year ended December 31, 2007. Loans measured at fair value were $4.59 billion at December 31, 2007.
Bank of America 2007
41