Bank of America 2007 Annual Report Download - page 78
Download and view the complete annual report
Please find page 78 of the 2007 Bank of America annual report below. You can navigate through the pages in the report by either clicking on the pages listed below, or by using the keyword search tool below to find specific information within the annual report.-
 1
1 -
2
-
3
-
4
-
5
-
6
-
7
-
8
-
9
-
10
-
11
-
12
-
13
-
14
-
15
-
16
-
17
-
18
-
19
-
20
-
21
-
22
-
23
-
24
-
25
-
26
-
27
-
28
-
29
-
30
-
31
-
32
-
33
-
34
-
35
-
36
-
37
-
38
-
39
-
40
-
41
-
42
-
43
-
44
-
45
-
46
-
47
-
48
-
49
-
50
-
51
-
52
-
53
-
54
-
55
-
56
-
57
-
58
-
59
-
60
-
61
-
62
-
63
-
64
-
65
-
66
-
67
-
 68
68 -
 69
69 -
 70
70 -
 71
71 -
 72
72 -
 73
73 -
 74
74 -
 75
75 -
 76
76 -
 77
77 -
 78
78 -
 79
79 -
 80
80 -
 81
81 -
 82
82 -
 83
83 -
 84
84 -
 85
85 -
 86
86 -
 87
87 -
 88
88 -
89
-
90
-
91
-
92
-
93
-
94
-
95
-
96
-
97
-
98
-
99
-
100
-
101
-
102
-
103
-
104
-
105
-
106
-
107
-
108
-
109
-
110
-
111
-
112
-
113
-
114
-
115
-
116
-
117
-
118
-
119
-
120
-
121
-
122
-
123
-
124
-
125
-
126
-
127
-
128
-
129
-
130
-
131
-
132
-
133
-
134
-
135
-
136
-
137
-
138
-
139
-
140
-
141
-
142
-
143
-
144
-
145
-
146
-
147
-
148
-
149
-
150
-
151
-
152
-
153
-
154
-
155
-
156
-
157
-
158
-
159
-
160
-
161
-
162
-
163
-
164
-
165
-
166
-
167
-
168
-
169
-
170
-
171
-
172
-
173
-
174
-
175
-
176
-
177
-
178
-
179
 |
 |

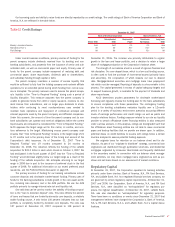
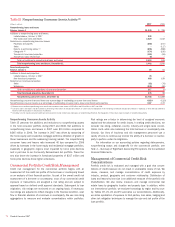
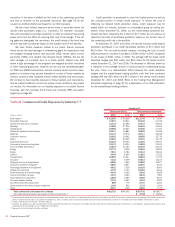
Table 16 presents our commercial loans and leases and related credit quality information for 2007 and 2006.
Table 16 Commercial Loans and Leases
December 31 Year Ended December 31
Outstandings Nonperforming
(1)
Accruing Past
Due 90 Days or
More
(2)
Net Charge-offs
(3)
Net Charge-off
Ratios
(4)
(Dollars in millions) 2007 2006 2007 2006 2007 2006 2007 2006 2007 2006
Commercial loans and leases
Commercial – domestic
(5)
$190,541
$148,255
$ 869
$505
$119
$66
$ 138
$ (25)
0.09%
(0.02)%
Commercial real estate
(6)
61,298
36,258
1,099
118
36
78
47
3
0.11
0.01
Commercial lease financing
22,582
21,864
33
42
25
26
2
(28)
0.01
(0.14)
Commercial – foreign
28,376
20,681
19
13
16
9
1
(8)
–
(0.04)
302,797
227,058
2,020
678
196
179
188
(58)
0.08
(0.03)
Small business commercial – domestic
(7)
17,756
13,727
135
79
427
199
869
361
5.57
3.00
Total measured at historical cost
320,553
240,785
2,155
757
623
378
1,057
303
0.40
0.13
Total measured at fair value
(8)
4,590
n/a
–
n/a
–
n/a
n/a
n/a
n/a
n/a
Total commercial loans and
leases
$325,143
$240,785
$2,155
$757
$623
$378
$1,057
$303
0.40
0.13
(1) Nonperforming commercial loans and leases as a percentage of outstanding commercial loans and leases measured at historical cost were 0.67 percent and 0.31 percent at December 31, 2007 and 2006. Including
commercial loans and leases measured at fair value the ratio would have been 0.66 percent at December 31, 2007.
(2) Accruing commercial loans and leases past due 90 days or more as a percentage of outstanding commercial loans and leases measured at historical cost were 0.19 percent and 0.16 percent at December 31, 2007 and
2006. Including commercial loans and leases measured at fair value the ratio would have remained unchanged at December 31, 2007.
(3) Includes a reduction in net charge-offs on commercial – domestic of $34 million, commercial – real estate of $27 million and commercial lease financing of $2 million as a result of the impact of SOP 03-3 for 2007. Includes a
reduction to small business commercial – domestic of $17 million as a result of the impact of SOP 03-3 for 2006. The impact of SOP 03-3 on average outstanding loans and leases was not material.
(4) Net charge-off ratios are calculated as net charge-offs divided by average outstanding loans and leases measured at historical cost during the year for each loan and lease category.
(5) Excludes small business commercial – domestic loans.
(6) Outstandings include domestic commercial real estate loans of $60.2 billion and $35.7 billion, and foreign commercial real estate loans of $1.1 billion and $578 million at December 31, 2007 and 2006.
(7) Small business commercial – domestic is primarily card related.
(8) Certain commercial loans are measured at fair value in accordance with SFAS 159 and include commercial – domestic loans of $3.5 billion, commercial – foreign loans of $790 million and commercial real estate loans of
$304 million at December 31, 2007.
n/a = not applicable
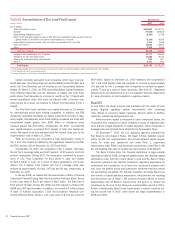
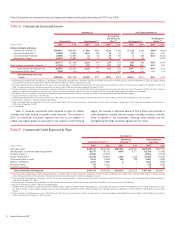
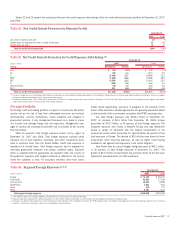
Table 17 presents commercial credit exposure by type for utilized,
unfunded and total binding committed credit exposure. The increase in
2007 to commercial committed exposure was due to the addition of
LaSalle and organic growth as discussed in the sections on the following
pages. The increase in derivative assets of $11.2 billion was centered in
credit derivatives, interest rate and foreign exchange contracts, and was
driven by growth in the businesses, widening credit spreads and the
strengthening of foreign currencies against the U.S. dollar.
Table 17 Commercial Credit Exposure by Type
December 31
Commercial Utilized
(1, 2)
Commercial
Unfunded
(3, 4)
Total Commercial
Committed
(Dollars in millions) 2007 2006 2007 2006 2007 2006
Loans and leases
$325,143
$240,785
$329,396
$269,937
$654,539
$510,722
Standby letters of credit and financial guarantees
58,747
48,729
4,049
4,277
62,796
53,006
Derivative assets
(5)
34,662
23,439
–
–
34,662
23,439
Assets held-for-sale
(6)
26,475
23,904
1,489
1,136
27,964
25,040
Commercial letters of credit
4,413
4,258
140
224
4,553
4,482
Bankers’ acceptances
2,411
1,885
2
1
2,413
1,886
Securitized assets
790
1,292
–
–
790
1,292
Foreclosed properties
75
10
–
–
75
10
Total commercial credit exposure
$452,716
$344,302
$335,076
$275,575
$787,792
$619,877
(1) Exposure includes standby letters of credit, financial guarantees, commercial letters of credit and bankers’ acceptances for which the bank is legally bound to advance funds under prescribed conditions, during a specified
period. Although funds have not been advanced, these exposure types are considered utilized for credit risk management purposes.
(2) Total commercial utilized exposure at December 31, 2007 includes loans and issued letters of credit measured at fair value in accordance with SFAS 159 and is comprised of loans outstanding of $4.59 billion and letters of
credit at notional value of $1.1 billion.
(3) Total commercial unfunded exposure at December 31, 2007 includes loan commitments measured at fair value in accordance with SFAS 159 with a notional value of $19.8 billion.
(4) Excludes unused business card lines which are not legally binding.
(5) Derivative assets are reported on a mark-to-market basis, reflect the effects of legally enforceable master netting agreements, and have been reduced by cash collateral of $12.8 billion and $7.3 billion at December 31, 2007
and 2006. In addition to cash collateral, derivative assets are also collateralized by $8.5 billion and $7.6 billion of primarily other marketable securities at December 31, 2007 and 2006 for which credit risk has not been
reduced.
(6) Total commercial committed exposure consists of $23.9 billion and $11.0 billion of commercial loans held-for-sale exposure (e.g., commercial mortgage and leveraged finance) and $4.1 billion and $14.0 billion of investments
held-for-sale exposure at December 31, 2007 and 2006.
76
Bank of America 2007