Bank of America 2007 Annual Report Download - page 73
Download and view the complete annual report
Please find page 73 of the 2007 Bank of America annual report below. You can navigate through the pages in the report by either clicking on the pages listed below, or by using the keyword search tool below to find specific information within the annual report.-
 1
1 -
2
-
3
-
4
-
5
-
6
-
7
-
8
-
9
-
10
-
11
-
12
-
13
-
14
-
15
-
16
-
17
-
18
-
19
-
20
-
21
-
22
-
23
-
24
-
25
-
26
-
27
-
28
-
29
-
30
-
31
-
32
-
33
-
34
-
35
-
36
-
37
-
38
-
39
-
40
-
41
-
42
-
43
-
44
-
45
-
46
-
47
-
48
-
49
-
50
-
51
-
52
-
53
-
54
-
55
-
56
-
57
-
58
-
59
-
60
-
61
-
62
-
 63
63 -
 64
64 -
 65
65 -
 66
66 -
 67
67 -
 68
68 -
 69
69 -
 70
70 -
 71
71 -
 72
72 -
 73
73 -
 74
74 -
 75
75 -
 76
76 -
 77
77 -
 78
78 -
 79
79 -
 80
80 -
 81
81 -
 82
82 -
 83
83 -
84
-
85
-
86
-
87
-
88
-
89
-
90
-
91
-
92
-
93
-
94
-
95
-
96
-
97
-
98
-
99
-
100
-
101
-
102
-
103
-
104
-
105
-
106
-
107
-
108
-
109
-
110
-
111
-
112
-
113
-
114
-
115
-
116
-
117
-
118
-
119
-
120
-
121
-
122
-
123
-
124
-
125
-
126
-
127
-
128
-
129
-
130
-
131
-
132
-
133
-
134
-
135
-
136
-
137
-
138
-
139
-
140
-
141
-
142
-
143
-
144
-
145
-
146
-
147
-
148
-
149
-
150
-
151
-
152
-
153
-
154
-
155
-
156
-
157
-
158
-
159
-
160
-
161
-
162
-
163
-
164
-
165
-
166
-
167
-
168
-
169
-
170
-
171
-
172
-
173
-
174
-
175
-
176
-
177
-
178
-
179
 |
 |

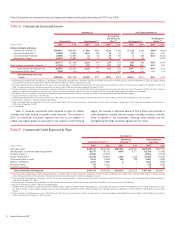
Table 13 Consumer Loans and Leases
December 31 Year Ended December 31
Outstandings Nonperforming
(1, 2)
Accruing Past
Due 90 Days
or More
(3)
Net Charge-
offs/Losses
Net Charge-off/
Loss Ratios
(4)
(Dollars in millions) 2007 2006 2007 2006 2007 2006 2007 2006 2007 2006
Held basis
Residential mortgage
$274,949
$241,181
$1,999
$ 660
$ 237
$ 118
$57
$39
0.02%
0.02%
Credit card – domestic
65,774
61,195
n/a
n/a
1,855
1,991
3,063
3,094
5.29
4.85
Credit card – foreign
14,950
10,999
n/a
n/a
272
184
378
225
3.06
2.46
Home equity
(5)
114,834
87,893
1,340
291
–
–
274
51
0.28
0.07
Direct/Indirect consumer
(5, 6)
76,844
59,378
8
2
745
378
1,373
610
1.95
1.14
Other consumer
(5, 7)
3,850
5,059
95
77
4
7
278
217
6.54
2.97
Total held
551,201
465,705
3,442
1,030
3,113
2,678
5,423
4,236
1.07
1.01
Securitization impact
108,646
110,151
2
2
2,764
2,407
5,003
3,371
4.54
3.22
Total consumer loans and leases – managed
$659,847
$575,856 $3,444 $1,032 $5,877 $5,085 $10,426 $7,607 1.69 1.45
Managed basis
Residential mortgage
$278,733
$245,840
$1,999
$ 660
$ 237
$ 118
$57
$39
0.02%
0.02%
Credit card – domestic
151,862
142,599
n/a
n/a
4,170
3,828
6,960
5,395
4.91
3.89
Credit card – foreign
31,829
27,890
n/a
n/a
714
608
1,254
980
4.24
3.95
Home equity
(5)
115,009
88,202
1,342
293
–
–
274
51
0.28
0.07
Direct/Indirect consumer
(5, 6)
78,564
66,266
8
2
752
524
1,603
925
2.14
1.49
Other consumer
(5, 7)
3,850
5,059
95
77
4
7
278
217
6.54
2.97
Total consumer loans and leases – managed
$659,847
$575,856
$3,444
$1,032
$5,877
$5,085
$10,426
$7,607
1.69
1.45
(1) The definition of nonperforming does not include consumer credit card and consumer non-real estate loans and leases. These loans are charged-off no later than the end of the month in which the account becomes 180 days
past due.
(2) Nonperforming consumer loans and leases as a percentage of outstanding consumer loans and leases were 0.62 percent and 0.22 percent on a held basis, and 0.52 percent and 0.18 percent on a managed basis at
December 31, 2007 and 2006.
(3) Accruing consumer loans and leases past due 90 days or more as a percentage of outstanding consumer loans and leases were 0.57 percent and 0.58 percent on a held basis, and 0.89 percent and 0.88 percent on a
managed basis at December 31, 2007 and 2006.
(4) Net charge-off/loss ratios are calculated as held net charge-offs or managed net losses divided by average outstanding held or managed loans and leases during the year for each loan and lease category.
(5) Home equity loan balances previously included in direct/indirect consumer and other consumer were reclassified to home equity to conform to current year presentation. Additionally, certain foreign consumer balances were
reclassified from other consumer to direct/indirect consumer to conform to current year presentation.
(6) Outstandings include foreign consumer loans of $3.4 billion and $3.9 billion at December 31, 2007 and 2006.
(7) Outstandings include foreign consumer loans of $829 million and $2.3 billion and consumer finance loans of $3.0 billion and $2.8 billion at December 31, 2007 and 2006.
n/a = not applicable
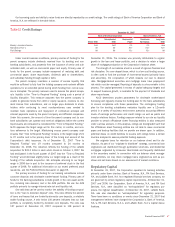
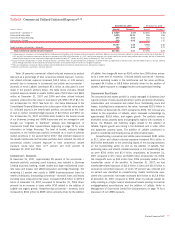
Consumer Credit Portfolio
Table 13 presents our held and managed consumer loans and leases, and
related credit quality information for 2007 and 2006. Overall, consumer
credit quality indicators deteriorated from the favorable levels experienced
in 2006. Weakness in the housing markets resulted in rising credit risk,
most notably in home equity.
Residential Mortgage
The residential mortgage portfolio makes up the largest percentage of our
consumer loan portfolio at 50 percent of held consumer loans and leases
and 42 percent of managed consumer loans and leases at December 31,
2007. Approximately 24 percent of the managed residential portfolio is in
GCSBB and GWIM and represents residential mortgages that are origi-
nated for the home purchase and refinancing needs of our customers. The
remaining portion of the managed portfolio is mostly in All Other, and is
comprised of purchased and originated residential mortgage loans used in
our overall ALM activities.
Residential mortgage loans to borrowers in the state of California
represented 34 percent and 33 percent of total residential mortgage loans
at December 31, 2007 and 2006. The Los Angeles-Long Beach-Santa Ana
MSA within California represented 11 percent of the total residential mort-
gage portfolio at both 2007 and 2006. In addition, residential mortgage
loans to borrowers in the state of Florida represented six percent and
seven percent of the total residential mortgage portfolio at December 31,
2007 and 2006. No single MSA within Florida represented more than 10
percent of the residential mortgage portfolio at December 31, 2007 and
2006. A portion of our credit risk on 68 percent and 56 percent of our
residential mortgage loans in California and Florida was mitigated through
the purchase of credit protection. See Management of Consumer Credit
Risk Concentrations beginning on page 70 for more information.
On a held basis, outstanding loans and leases increased $33.8 bil-
lion at December 31, 2007 compared to 2006 driven by retained mort-
gage production and the acquisition of LaSalle. Nonperforming balances
increased $1.3 billion due to portfolio seasoning reflective of growth in the
business and the impact of the weak housing market. At December 31,
2007 and 2006, loans past due 90 days or more and still accruing inter-
est of $237 million and $118 million were related to repurchases pur-
suant to our servicing agreements with Government National Mortgage
Association (GNMA) mortgage pools where repayments are insured by the
Federal Housing Administration or guaranteed by the Department of Veter-
ans Affairs.
Due to current market conditions, members of the mortgage servicing
industry are evaluating a number of programs for identifying subprime
residential mortgage loan borrowers who are at risk of default and offering
loss mitigation strategies, including repayment plans and loan mod-
ifications, to such borrowers. Generally these programs require that the
borrower and subprime residential mortgage loan meet certain criteria in
order to qualify for a modification. The SEC’s Office of the Chief Account-
ant (OCA) noted that if certain loan modification requirements are met, the
OCA will not object to continued status of the transferee as a QSPE under
SFAS 140. We do not currently originate or service significant subprime
residential mortgage loans, nor do we hold a significant amount of benefi-
cial interests in QSPE securitizations of subprime residential mortgage
loans. We do not expect that the implementation of these programs
will have a significant impact on our financial condition and results of
operations.
Bank of America 2007
71