Bank of America 2007 Annual Report Download - page 87
Download and view the complete annual report
Please find page 87 of the 2007 Bank of America annual report below. You can navigate through the pages in the report by either clicking on the pages listed below, or by using the keyword search tool below to find specific information within the annual report.-
 1
1 -
2
-
3
-
4
-
5
-
6
-
7
-
8
-
9
-
10
-
11
-
12
-
13
-
14
-
15
-
16
-
17
-
18
-
19
-
20
-
21
-
22
-
23
-
24
-
25
-
26
-
27
-
28
-
29
-
30
-
31
-
32
-
33
-
34
-
35
-
36
-
37
-
38
-
39
-
40
-
41
-
42
-
43
-
44
-
45
-
46
-
47
-
48
-
49
-
50
-
51
-
52
-
53
-
54
-
55
-
56
-
57
-
58
-
59
-
60
-
61
-
62
-
63
-
64
-
65
-
66
-
67
-
68
-
69
-
70
-
71
-
72
-
73
-
74
-
75
-
76
-
 77
77 -
 78
78 -
 79
79 -
 80
80 -
 81
81 -
 82
82 -
 83
83 -
 84
84 -
 85
85 -
 86
86 -
 87
87 -
 88
88 -
 89
89 -
 90
90 -
 91
91 -
 92
92 -
 93
93 -
 94
94 -
 95
95 -
 96
96 -
 97
97 -
98
-
99
-
100
-
101
-
102
-
103
-
104
-
105
-
106
-
107
-
108
-
109
-
110
-
111
-
112
-
113
-
114
-
115
-
116
-
117
-
118
-
119
-
120
-
121
-
122
-
123
-
124
-
125
-
126
-
127
-
128
-
129
-
130
-
131
-
132
-
133
-
134
-
135
-
136
-
137
-
138
-
139
-
140
-
141
-
142
-
143
-
144
-
145
-
146
-
147
-
148
-
149
-
150
-
151
-
152
-
153
-
154
-
155
-
156
-
157
-
158
-
159
-
160
-
161
-
162
-
163
-
164
-
165
-
166
-
167
-
168
-
169
-
170
-
171
-
172
-
173
-
174
-
175
-
176
-
177
-
178
-
179
 |
 |

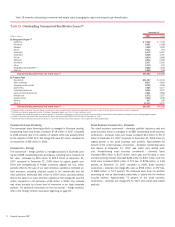
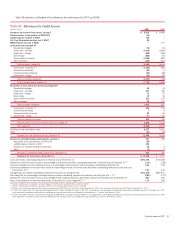
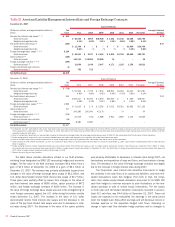
Table 26 presents a rollforward of the allowance for credit losses for 2007 and 2006.
Table 26 Allowance for Credit Losses
(Dollars in millions) 2007 2006
Allowance for loan and lease losses, January 1
$ 9,016
$ 8,045
Adjustment due to the adoption of SFAS 159
(32)
–
LaSalle balance, October 1, 2007
725
–
U.S. Trust Corporation balance, July 1, 2007
25
–
MBNA balance, January 1, 2006
–
577
Loans and leases charged off
Residential mortgage
(79)
(74)
Credit card – domestic
(3,410)
(3,546)
Credit card – foreign
(452)
(292)
Home equity
(286)
(67)
Direct/Indirect consumer
(1,885)
(857)
Other consumer
(346)
(327)
Total consumer charge-offs
(6,458)
(5,163)
Commercial – domestic
(1)
(1,135)
(597)
Commercial real estate
(54)
(7)
Commercial lease financing
(55)
(28)
Commercial – foreign
(28)
(86)
Total commercial charge-offs
(1,272)
(718)
Total loans and leases charged off
(7,730)
(5,881)
Recoveries of loans and leases previously charged off
Residential mortgage
22
35
Credit card – domestic
347
452
Credit card – foreign
74
67
Home equity
12
16
Direct/Indirect consumer
512
247
Other consumer
68
110
Total consumer recoveries
1,035
927
Commercial – domestic
(2)
128
261
Commercial real estate
7
4
Commercial lease financing
53
56
Commercial – foreign
27
94
Total commercial recoveries
215
415
Total recoveries of loans and leases previously charged off
1,250
1,342
Net charge-offs
(6,480)
(4,539)
Provision for loan and lease losses
8,357
5,001
Other
(23)
(68)
Allowance for loan and lease losses, December 31
11,588
9,016
Reserve for unfunded lending commitments, January 1
397
395
Adjustment due to the adoption of SFAS 159
(28)
–
LaSalle balance, October 1, 2007
124
–
Provision for unfunded lending commitments
28
9
Other
(3)
(7)
Reserve for unfunded lending commitments, December 31
518
397
Allowance for credit losses, December 31
$ 12,106
$ 9,413
Loans and leases outstanding measured at historical cost at December 31
$871,754
$706,490
Allowance for loan and lease losses as a percentage of total loans and leases outstanding measured at historical cost at December 31
(3)
1.33%
1.28%
Consumer allowance for loan and lease losses as a percentage of total consumer loans and leases outstanding at December 31
1.23
1.19
Commercial allowance for loan and lease losses as a percentage of total commercial loans and leases outstanding measured at historical cost
at December 31
(3)
1.51
1.44
Average loans and leases outstanding measured at historical cost during the year
$773,142
$652,417
Net charge-offs as a percentage of average loans and leases outstanding measured at historical cost during the year
(3, 4, 5)
0.84%
0.70%
Allowance for loan and lease losses as a percentage of total nonperforming loans and leases measured at historical cost at December 31
207
505
Ratio of the allowance for loan and lease losses at December 31 to net charge-offs
(4, 5)
1.79
1.99
(1) Includes small business commercial – domestic charge offs of $911 million and $409 million in 2007 and 2006.
(2) Includes small business commercial – domestic recoveries of $42 million and $48 million in 2007 and 2006.
(3) Ratios do not include loans measured at fair value in accordance with SFAS 159 at and for the year ended December 31, 2007. Loans measured at fair value were $4.59 billion at December 31, 2007.
(4) In 2007, the impact of SOP 03-3 decreased net charge-offs by $75 million. Excluding the impact of SOP 03-3, net charge-offs as a percentage of average loans and leases outstanding measured at historical cost in 2007
would have been 0.85 percent and the ratio of the allowance for loan and lease losses to net charge-offs would have been 1.77 percent at December 31, 2007.
(5) In 2006, the impact of SOP 03-3 decreased net charge-offs by $288 million. Excluding the impact of SOP 03-3, net charge-offs as a percentage of average loans and leases outstanding measured at historical cost in 2006
would have been 0.74 percent, and the ratio of the allowance for loan and lease losses to net charge-offs would have been 1.87 percent at December 31, 2006.
Bank of America 2007
85