Bank of America 2007 Annual Report Download - page 53
Download and view the complete annual report
Please find page 53 of the 2007 Bank of America annual report below. You can navigate through the pages in the report by either clicking on the pages listed below, or by using the keyword search tool below to find specific information within the annual report.-
 1
1 -
2
-
3
-
4
-
5
-
6
-
7
-
8
-
9
-
10
-
11
-
12
-
13
-
14
-
15
-
16
-
17
-
18
-
19
-
20
-
21
-
22
-
23
-
24
-
25
-
26
-
27
-
28
-
29
-
30
-
31
-
32
-
33
-
34
-
35
-
36
-
37
-
38
-
39
-
40
-
41
-
42
-
 43
43 -
 44
44 -
 45
45 -
 46
46 -
 47
47 -
 48
48 -
 49
49 -
 50
50 -
 51
51 -
 52
52 -
 53
53 -
 54
54 -
 55
55 -
 56
56 -
 57
57 -
 58
58 -
 59
59 -
 60
60 -
 61
61 -
 62
62 -
 63
63 -
64
-
65
-
66
-
67
-
68
-
69
-
70
-
71
-
72
-
73
-
74
-
75
-
76
-
77
-
78
-
79
-
80
-
81
-
82
-
83
-
84
-
85
-
86
-
87
-
88
-
89
-
90
-
91
-
92
-
93
-
94
-
95
-
96
-
97
-
98
-
99
-
100
-
101
-
102
-
103
-
104
-
105
-
106
-
107
-
108
-
109
-
110
-
111
-
112
-
113
-
114
-
115
-
116
-
117
-
118
-
119
-
120
-
121
-
122
-
123
-
124
-
125
-
126
-
127
-
128
-
129
-
130
-
131
-
132
-
133
-
134
-
135
-
136
-
137
-
138
-
139
-
140
-
141
-
142
-
143
-
144
-
145
-
146
-
147
-
148
-
149
-
150
-
151
-
152
-
153
-
154
-
155
-
156
-
157
-
158
-
159
-
160
-
161
-
162
-
163
-
164
-
165
-
166
-
167
-
168
-
169
-
170
-
171
-
172
-
173
-
174
-
175
-
176
-
177
-
178
-
179
 |
 |

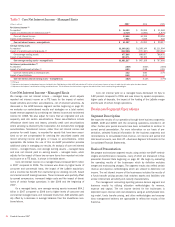
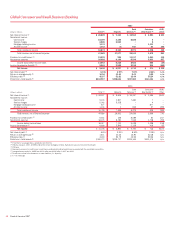
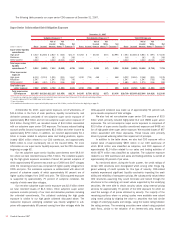
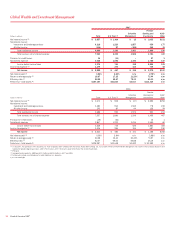
December 31 Average Balance
(Dollars in millions) 2007 2006
2007
2006
Total loans and leases
$324,198
$242,700
$274,015
$232,623
Total trading-related assets
308,315
309,097
362,193
336,860
Total market-based earning assets
(1)
359,730
348,717
412,326
370,187
Total earning assets
(2)
673,552
599,326
676,500
609,100
Total assets
(2)
776,107
685,935
770,360
691,414
Total deposits
246,788
212,028
220,724
194,972
(1) Total market-based earning assets represents earning assets included in CMAS but excludes loans for which the fair value option has been elected.
(2) Total earning assets and total assets include asset allocations to match liabilities (i.e., deposits).
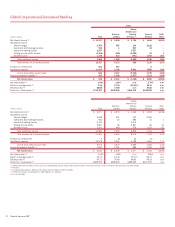
GCIB provides a wide range of financial services to both our issuer
and investor clients that range from business banking clients to large
international corporate and institutional investor clients using a strategy to
deliver value-added financial products and advisory solutions. GCIB’s
products and services are delivered from three primary businesses: Busi-
ness Lending, CMAS, and Treasury Services, and are provided to our cli-
ents through a global team of client relationship managers and product
partners. In addition, ALM/Other includes the results of ALM activities and
other GCIB activities (e.g., Commercial Insurance business which was sold
in the fourth quarter of 2007). Our clients are supported through offices in
22 countries that are divided into four distinct geographic regions: U.S.
and Canada; Asia; Europe, Middle East, and Africa; and Latin America. For
more information on our foreign operations, see Foreign Portfolio beginning
on page 81.
Effective January 1, 2007, the Corporation adopted SFAS 159 and
elected to account for loans and loan commitments to certain large corpo-
rate clients at fair value. For more information on the adoption of SFAS
159, see Note 19 – Fair Value Disclosures to the Consolidated Financial
Statements and see page 74 for a discussion of loans and loan commit-
ments measured at fair value in accordance with SFAS 159. The results of
loans and loan commitments to certain large corporate clients for which
the Corporation elected the fair value option (including the associated risk
mitigation tools) are recorded in CMAS.
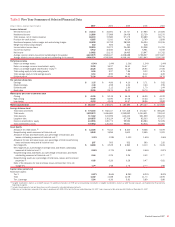
Net income decreased $5.5 billion, or 91 percent, to $538 million and
total revenue decreased $7.7 billion, or 37 percent, to $13.4 billion in
2007 compared to 2006. These decreases were driven by $5.6 billion of
losses resulting from our CDO exposure and other trading losses. Addition-
ally, we experienced increases in provision for credit losses and noninterest
expense, which were partially offset by an increase in net interest income.
Net interest income increased $1.3 billion, or 14 percent, due to
higher market-based net interest income of $1.1 billion and the FTE
impact of a one-time tax benefit from restructuring our existing non-U.S.
based commercial aircraft leasing business. Additionally, the benefit of
growth in average loans and leases of $41.4 billion, or 18 percent, was
partially offset by spread compression on core lending and deposit-related
activities, and a change in the mix between interest-bearing and
noninterest-bearing deposits as clients maintained lower noninterest-
bearing compensating balances by shifting to interest bearing and/or
higher yielding investment alternatives. The growth in average loans and
average deposits was due to organic growth as well as the LaSalle merger.
Noninterest income decreased $9.1 billion, or 81 percent, in 2007
compared to 2006, driven by declines in trading account profits (losses) of
$8.1 billion and all other income of $1.1 billion. For more information on
these decreases, see the CMAS discussion.
Provision for credit losses was $652 million in 2007 compared to $9
million in 2006. The increase was driven by the absence of 2006 releases
of reserves, higher net charge-offs and an increase in reserves during
2007 reflecting the impact of the weak housing market particularly on the
homebuilder loan portfolio. Net charge-offs increased in the retail automo-
tive and other dealer-related portfolios due to growth, seasoning and
deterioration, as well as from a lower level of commercial recoveries.
Noninterest expense increased $347 million, or three percent, mainly
due to the addition of LaSalle and Visa-related litigation costs, equally
allocated to Treasury Services and Card Services on a management
accounting basis, partially offset by a reduction in performance-based
incentive compensation in CMAS. For additional information on Visa-
related litigation, see Note 13 – Commitments and Contingencies to the
Consolidated Financial Statements.
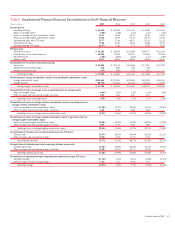
Business Lending
Business Lending provides a wide range of lending-related products and
services to our clients through client relationship teams along with various
product partners. Products include commercial and corporate bank loans
and commitment facilities which cover our business banking clients, mid-
dle market commercial clients and our large multinational corporate cli-
ents. Real estate lending products are issued primarily to public and
private developers, homebuilders and commercial real estate firms. Leas-
ing and asset-based lending products offer our clients innovative financing
solutions. Products also include indirect consumer loans which allow us to
offer financing through automotive, marine, motorcycle and recreational
vehicle dealerships across the U.S. Business Lending also contains the
results for the economic hedging of our risk to certain credit counter-
parties utilizing various risk mitigation tools.
Net income decreased $128 million, or six percent, to $2.1 billion in
2007 compared to 2006 as increases in net interest income and non-
interest income were more than offset by increases in provision for credit
losses and noninterest expense. Net interest income increased $445 mil-
lion, or 10 percent, driven by the FTE impact of approximately $350 million
related to a one-time tax benefit from restructuring our existing non-U.S.
based commercial aircraft leasing business, and average loan growth of
14 percent. These increases were partially offset by the impact of spread
compression on the loan portfolio. The increase in average loans and
leases was attributable to growth in commercial loans, the LaSalle merger
and increases in the indirect consumer loan portfolio related to bulk pur-
chases of retail automotive loans. The increase in noninterest income of
$112 million, or 11 percent, was driven by improved economic hedging
results of our exposures to certain large corporate clients and higher tax
credits from community development activities partially offset by derivative
fair value adjustments related to an option to purchase retail automotive
loans.
Provision for credit losses was $647 million in 2007 compared to
negative $2 million in 2006. The increase was driven by the absence of
2006 releases of reserves related to favorable commercial credit market
conditions, higher net charge-offs and an increase in reserves during 2007
reflecting the impact of the weak housing market particularly on the home-
builder loan portfolio. Net charge-offs increased in 2007 as retail automo-
tive and other dealer-related portfolio losses rose due to growth,
Bank of America 2007
51