Bank of America 2007 Annual Report Download - page 99
Download and view the complete annual report
Please find page 99 of the 2007 Bank of America annual report below. You can navigate through the pages in the report by either clicking on the pages listed below, or by using the keyword search tool below to find specific information within the annual report.-
 1
1 -
2
-
3
-
4
-
5
-
6
-
7
-
8
-
9
-
10
-
11
-
12
-
13
-
14
-
15
-
16
-
17
-
18
-
19
-
20
-
21
-
22
-
23
-
24
-
25
-
26
-
27
-
28
-
29
-
30
-
31
-
32
-
33
-
34
-
35
-
36
-
37
-
38
-
39
-
40
-
41
-
42
-
43
-
44
-
45
-
46
-
47
-
48
-
49
-
50
-
51
-
52
-
53
-
54
-
55
-
56
-
57
-
58
-
59
-
60
-
61
-
62
-
63
-
64
-
65
-
66
-
67
-
68
-
69
-
70
-
71
-
72
-
73
-
74
-
75
-
76
-
77
-
78
-
79
-
80
-
81
-
82
-
83
-
84
-
85
-
86
-
87
-
88
-
 89
89 -
 90
90 -
 91
91 -
 92
92 -
 93
93 -
 94
94 -
 95
95 -
 96
96 -
 97
97 -
 98
98 -
 99
99 -
 100
100 -
 101
101 -
 102
102 -
 103
103 -
 104
104 -
 105
105 -
 106
106 -
 107
107 -
 108
108 -
 109
109 -
110
-
111
-
112
-
113
-
114
-
115
-
116
-
117
-
118
-
119
-
120
-
121
-
122
-
123
-
124
-
125
-
126
-
127
-
128
-
129
-
130
-
131
-
132
-
133
-
134
-
135
-
136
-
137
-
138
-
139
-
140
-
141
-
142
-
143
-
144
-
145
-
146
-
147
-
148
-
149
-
150
-
151
-
152
-
153
-
154
-
155
-
156
-
157
-
158
-
159
-
160
-
161
-
162
-
163
-
164
-
165
-
166
-
167
-
168
-
169
-
170
-
171
-
172
-
173
-
174
-
175
-
176
-
177
-
178
-
179
 |
 |
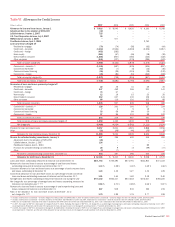
Business Segment Operations
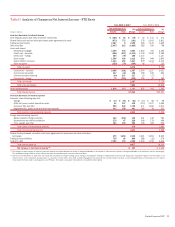
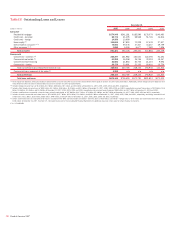
Global Consumer and Small Business Banking
Net income increased $4.4 billion, or 62 percent, to $11.4 billion in 2006
compared to 2005. Total revenue rose $16.5 billion, or 58 percent, in
2006 compared to 2005, driven by increases in net interest income and
noninterest income. The MBNA merger and organic growth in average
loans and leases contributed to the $10.6 billion, or 60 percent, increase
in net interest income. Increases in card income of $4.9 billion, all other
income of $806 million and service charges of $348 million drove the
$5.9 billion, or 54 percent, increase in noninterest income. Card income
was higher mainly due to increases in interchange income, cash advance
fees and late fees due primarily to the impact of the MBNA merger. All
other income increased primarily as a result of the MBNA merger. Service
charges increased due to new account growth and increased usage. These
increases were partially offset by increases in the provision for credit
losses and noninterest expense. The provision for credit losses increased
$3.8 billion to $8.5 billion in 2006 resulting primarily from an increase in
Card Services mainly due to the MBNA merger. Noninterest expense
increased $5.6 billion, or 44 percent, primarily driven by the addition of
MBNA.
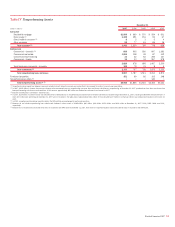
Global Corporate and Investment Banking
Net income increased $78 million, or one percent, to $6.0 billion in 2006
compared to 2005. Total revenue increased $1.3 billion, or seven percent,
in 2006 driven by increases in noninterest income partially offset by a
decrease in net interest income. Net interest income declined $460 mil-
lion, or four percent, primarily due to the impact of ALM activities and
spread compression in the loan portfolio. Noninterest income increased
$1.8 billion, or 18 percent, driven by the increase in trading account prof-
its (losses) of $1.2 billion and investment banking income of $585 million
mainly due to the continued strength in debt underwriting, sales and trad-
ing, and a favorable market environment. These increases were partially
offset by an increase in noninterest expense which increased by $1.1 bil-
lion, or 11 percent, mainly due to higher personnel expense, including
performance-based incentive compensation primarily in CMAS and other
general operating costs.
Global Wealth and Investment Management
Net income increased $211 million, or 10 percent, to $2.2 billion in 2006
compared to 2005. Total revenue increased $483 million, or seven per-
cent, in 2006. Net interest income increased $117 million, or three per-
cent, due to an increase in deposit spreads and higher average loans and
leases, largely offset by a decline in ALM activities and loan spread com-
pression. GWIM also benefited from the migration of deposits from
GCSBB. For 2006 and 2005 a total of $10.7 billion and $16.9 billion of
net deposits were migrated from GCSBB to GWIM. Noninterest income
increased $366 million, or 11 percent, mainly due to increases in invest-
ment and brokerage services driven by higher levels of AUM. These
changes were offset by higher noninterest expense which increased $126
million, or three percent, primarily due to increases in personnel-related
expense driven by the addition of sales associates and revenue-related
expenses.
All Other
Net income increased $23 million, or two percent, to $1.5 billion in 2006
compared to 2005. Excluding the securitization offset, total revenue rose
$441 million to $3.7 billion, primarily driven by increases in net interest
income of $1.1 billion, equity investment income of $839 million and all
other income of $861 million partially offset by lower gains (losses) on
sales of debt securities. The increase in net interest income was mainly
due to the negative impact to 2005 results retained in All Other relating to
funds transfer pricing that was not allocated to the businesses. The
increase in equity investment income was due to favorable market con-
ditions driving liquidity in the Principal Investing portfolio combined with a
gain recorded on the liquidation of a strategic European investment. The
increase in all other income was primarily related to the gain on the sale
of our Brazilian operations of $720 million. Gains (losses) on sales of debt
securities decreased $1.4 billion to $(475) million resulting from a loss on
the sale of mortgage-backed securities compared with gains recorded on
the sales of mortgage-backed securities in 2005. Merger and restructuring
charges increased $393 million due to the MBNA merger whereas the
2005 charges primarily related to the FleetBoston Financial Corporation
merger.
Bank of America 2007
97