Bank of America 2007 Annual Report Download - page 135
Download and view the complete annual report
Please find page 135 of the 2007 Bank of America annual report below. You can navigate through the pages in the report by either clicking on the pages listed below, or by using the keyword search tool below to find specific information within the annual report.-
 1
1 -
2
-
3
-
4
-
5
-
6
-
7
-
8
-
9
-
10
-
11
-
12
-
13
-
14
-
15
-
16
-
17
-
18
-
19
-
20
-
21
-
22
-
23
-
24
-
25
-
26
-
27
-
28
-
29
-
30
-
31
-
32
-
33
-
34
-
35
-
36
-
37
-
38
-
39
-
40
-
41
-
42
-
43
-
44
-
45
-
46
-
47
-
48
-
49
-
50
-
51
-
52
-
53
-
54
-
55
-
56
-
57
-
58
-
59
-
60
-
61
-
62
-
63
-
64
-
65
-
66
-
67
-
68
-
69
-
70
-
71
-
72
-
73
-
74
-
75
-
76
-
77
-
78
-
79
-
80
-
81
-
82
-
83
-
84
-
85
-
86
-
87
-
88
-
89
-
90
-
91
-
92
-
93
-
94
-
95
-
96
-
97
-
98
-
99
-
100
-
101
-
102
-
103
-
104
-
105
-
106
-
107
-
108
-
109
-
110
-
111
-
112
-
113
-
114
-
115
-
116
-
117
-
118
-
119
-
120
-
121
-
122
-
123
-
124
-
 125
125 -
 126
126 -
 127
127 -
 128
128 -
 129
129 -
 130
130 -
 131
131 -
 132
132 -
 133
133 -
 134
134 -
 135
135 -
 136
136 -
 137
137 -
 138
138 -
 139
139 -
 140
140 -
 141
141 -
 142
142 -
 143
143 -
 144
144 -
 145
145 -
146
-
147
-
148
-
149
-
150
-
151
-
152
-
153
-
154
-
155
-
156
-
157
-
158
-
159
-
160
-
161
-
162
-
163
-
164
-
165
-
166
-
167
-
168
-
169
-
170
-
171
-
172
-
173
-
174
-
175
-
176
-
177
-
178
-
179
 |
 |

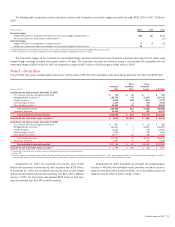
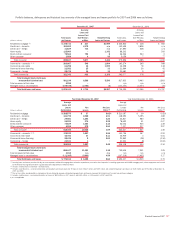
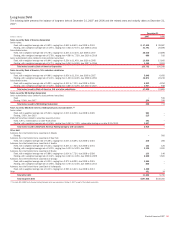
December 31, 2007
Due in one year or
less
Due after one year
through five years
Due after five years
through ten years Due after ten years Total
(Dollars in millions) Amount Yield
(1)
Amount Yield
(1)
Amount Yield
(1)
Amount Yield
(1)
Amount Yield
(1)
Fair value of available-for-sale debt securities
U.S. Treasury securities and agency
debentures $ 93 3.82% $ 541 3.97% $ 119 4.45% $ 6 5.82% $ 759 4.04%
Mortgage-backed securities 30 7.50 7,484 5.20 141,558 5.08 14,644 6.81 163,716 5.24
Foreign securities 1,658 4.57 4,095 5.52 54 8.96 950 7.57 6,757 5.67
Corporate/Agency bonds 215 4.30 1,032 4.47 1,691 4.97 95 5.52 3,033 4.77
Other taxable securities 13,044 4.69 7,017 5.13 2,399 5.76 2,133 5.59 24,593 5.00
Total taxable securities 15,040 4.67 20,169 5.17 145,821 5.09 17,828 6.70 198,858 5.21
Tax-exempt securities
(2)
352 5.79 2,891 5.89 8,058 6.38 3,171 6.86 14,472 6.38
Total available-for-sale debt securities
$15,392 4.69 $23,060 5.26 $153,879 5.16 $20,999 6.72 $213,330 5.29
Amortized cost of available-for-sale debt
securities
$15,120 $23,205 $156,495 $21,448 $216,268
(1) Yields are calculated based on the amortized cost of the securities.
(2) Yields of tax-exempt securities are calculated on a fully taxable-equivalent (FTE) basis.
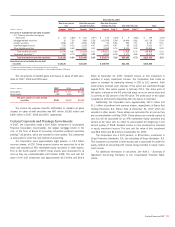
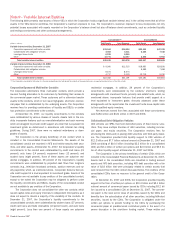
The components of realized gains and losses on sales of debt secu-
rities for 2007, 2006 and 2005 were:
(Dollars in millions) 2007 2006 2005
Gross gains
$197
$ 87 $1,154
Gross losses
(17)
(530) (70)
Net gains (losses) on sales of debt
securities
$180
$(443) $1,084
The income tax expense (benefit) attributable to realized net gains
(losses) on sales of debt securities was $67 million, $(163) million and
$400 million in 2007, 2006 and 2005, respectively.
Certain Corporate and Strategic Investments
In 2007, the Corporation made a $2.0 billion investment in Countrywide
Financial Corporation (Countrywide), the largest mortgage lender in the
U.S., in the form of Series B non-voting convertible preferred securities
yielding 7.25 percent, which are recorded in other assets. This investment
is accounted for under the cost method of accounting.
The Corporation owns approximately eight percent, or 19.1 billion
common shares, of CCB. These common shares are accounted for at fair
value and recorded as AFS marketable equity securities in other assets.
Prior to the fourth quarter of 2007, these shares were accounted for at
cost as they are nontransferable until October 2008. The cost and fair
value of the CCB investment was approximately $3.0 billion and $16.4
billion at December 31, 2007. Dividend income on this investment is
recorded in equity investment income. The Corporation also holds an
option to increase its ownership interest in CCB to 19.1 percent. Addi-
tional shares received upon exercise of this option are restricted through
August 2011. This option expires in February 2011. The strike price of
the option is based on the IPO price that steps up on an annual basis and
is currently at 103 percent of the IPO price. The strike price of the option
is capped at 118 percent depending when the option is exercised.
Additionally, the Corporation owns approximately 137.0 million and
41.1 million of preferred and common shares, respectively, of Banco Itaú
Holding Financeira S.A. (Banco Itaú) at December 31, 2007 which are
recorded in other assets. These shares are accounted for at cost as they
are non-transferable until May 2009. These shares are currently carried at
cost but will be accounted for as AFS marketable equity securities and
carried at fair value with an offset to accumulated OCI beginning in the
second quarter of 2008. Dividend income on this investment is recorded
in equity investment income. The cost and fair value of this investment
was $2.6 billion and $4.6 billion at December 31, 2007.
The Corporation has a 24.9 percent, or $2.6 billion, investment in
Grupo Financiero Santander, S.A., the subsidiary of Grupo Santander, S.A.
This investment is recorded in other assets and is accounted for under the
equity method of accounting with income being recorded in equity invest-
ment income.
For additional information on securities, see Note 1 – Summary of
Significant Accounting Principles to the Consolidated Financial State-
ments.
Bank of America 2007
133