Bank of America 2007 Annual Report Download - page 76
Download and view the complete annual report
Please find page 76 of the 2007 Bank of America annual report below. You can navigate through the pages in the report by either clicking on the pages listed below, or by using the keyword search tool below to find specific information within the annual report.-
 1
1 -
2
-
3
-
4
-
5
-
6
-
7
-
8
-
9
-
10
-
11
-
12
-
13
-
14
-
15
-
16
-
17
-
18
-
19
-
20
-
21
-
22
-
23
-
24
-
25
-
26
-
27
-
28
-
29
-
30
-
31
-
32
-
33
-
34
-
35
-
36
-
37
-
38
-
39
-
40
-
41
-
42
-
43
-
44
-
45
-
46
-
47
-
48
-
49
-
50
-
51
-
52
-
53
-
54
-
55
-
56
-
57
-
58
-
59
-
60
-
61
-
62
-
63
-
64
-
65
-
 66
66 -
 67
67 -
 68
68 -
 69
69 -
 70
70 -
 71
71 -
 72
72 -
 73
73 -
 74
74 -
 75
75 -
 76
76 -
 77
77 -
 78
78 -
 79
79 -
 80
80 -
 81
81 -
 82
82 -
 83
83 -
 84
84 -
 85
85 -
 86
86 -
87
-
88
-
89
-
90
-
91
-
92
-
93
-
94
-
95
-
96
-
97
-
98
-
99
-
100
-
101
-
102
-
103
-
104
-
105
-
106
-
107
-
108
-
109
-
110
-
111
-
112
-
113
-
114
-
115
-
116
-
117
-
118
-
119
-
120
-
121
-
122
-
123
-
124
-
125
-
126
-
127
-
128
-
129
-
130
-
131
-
132
-
133
-
134
-
135
-
136
-
137
-
138
-
139
-
140
-
141
-
142
-
143
-
144
-
145
-
146
-
147
-
148
-
149
-
150
-
151
-
152
-
153
-
154
-
155
-
156
-
157
-
158
-
159
-
160
-
161
-
162
-
163
-
164
-
165
-
166
-
167
-
168
-
169
-
170
-
171
-
172
-
173
-
174
-
175
-
176
-
177
-
178
-
179
 |
 |

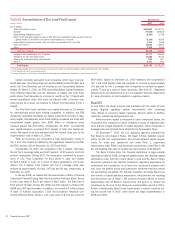
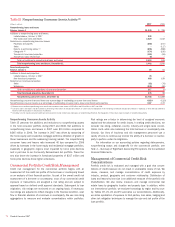
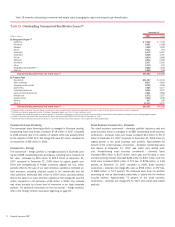
Table 15 Nonperforming Consumer Assets Activity (1)
(Dollars in millions) 2007 2006
Nonperforming loans and leases
Balance, January 1
$1,030
$ 785
Additions to nonperforming loans and leases:
LaSalle balance, October 1, 2007
232
–
New nonaccrual loans and leases
3,829
1,432
Reductions in nonperforming loans and leases:
Paydowns and payoffs
(260)
(157)
Sales
–
(117)
Returns to performing status
(2)
(855)
(698)
Charge-offs
(3)
(374)
(150)
Transfers to foreclosed properties
(152)
(65)
Transfers to loans held-for-sale
(8)
–
Total net additions to nonperforming loans and leases
2,412
245
Total nonperforming loans and leases, December 31
3,442
1,030
Foreclosed properties
Balance, January 1
59
61
Additions to foreclosed properties:
LaSalle balance, October 1, 2007
70
–
New foreclosed properties
468
159
Reductions in foreclosed properties:
Sales
(82)
(76)
Writedowns
(239)
(85)
Total net additions to (reductions in) foreclosed properties
217
(2)
Total foreclosed properties, December 31
276
59
Nonperforming consumer assets, December 31
$3,718
$1,089
Nonperforming consumer loans and leases as a percentage of outstanding consumer loans and leases
0.62%
0.22%
Nonperforming consumer assets as a percentage of outstanding consumer loans, leases and foreclosed properties
0.67
0.23
(1) Balances do not include nonperforming loans held-for-sale included in other assets of $95 million and $30 million in 2007 and 2006.
(2) Consumer loans and leases may be restored to performing status when all principal and interest is current and full repayment of the remaining contractual principal and interest is expected, or when the loan otherwise
becomes well-secured and is in the process of collection.
(3) Our policy is not to classify consumer credit card and consumer non-real estate loans and leases as nonperforming; therefore, the charge-offs on these loans have no impact on nonperforming activity.
Nonperforming Consumer Assets Activity
Table 15 presents the additions and reductions to nonperforming assets
in the held consumer portfolio during 2007 and 2006. Net additions to
nonperforming loans and leases in 2007 were $2.4 billion compared to
$245 million in 2006. The increase in 2007 was driven by seasoning of
the home equity and residential mortgage portfolios reflective of growth in
these businesses and the weakening housing market. The nonperforming
consumer loans and leases ratio increased 40 bps compared to 2006
driven by increases in the home equity and residential mortgage portfolios,
especially in geographic regions most impacted by home price declines
and in part due to our Community Reinvestment Act portfolio. These fac-
tors also drove the increase in foreclosed properties of $217 million and
home price declines drove higher writedowns.
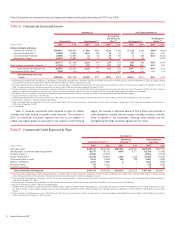
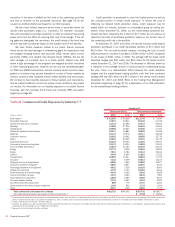
Commercial Portfolio Credit Risk Management
Credit risk management for the commercial portfolio begins with an
assessment of the credit risk profile of the borrower or counterparty based
on an analysis of their financial position. As part of the overall credit risk
assessment of a borrower or counterparty, most of our commercial credit
exposure or transactions are assigned a risk rating and are subject to
approval based on defined credit approval standards. Subsequent to loan
origination, risk ratings are monitored on an ongoing basis. If necessary,
risk ratings are adjusted to reflect changes in the financial condition, cash
flow or financial situation of a borrower or counterparty. We use risk rating
aggregations to measure and evaluate concentrations within portfolios.
Risk ratings are a factor in determining the level of assigned economic
capital and the allowance for credit losses. In making credit decisions, we
consider risk rating, collateral, country, industry and single name concen-
tration limits while also balancing the total borrower or counterparty rela-
tionship. Our lines of business and risk management personnel use a
variety of tools to continuously monitor the ability of a borrower or counter-
party to perform under its obligations.
For information on our accounting policies regarding delinquencies,
nonperforming status and charge-offs for the commercial portfolio, see
Note 1 – Summary of Significant Accounting Principles to the Consolidated
Financial Statements.
Management of Commercial Credit Risk
Concentrations
Portfolio credit risk is evaluated and managed with a goal that concen-
trations of credit exposure do not result in undesirable levels of risk. We
review, measure, and manage concentrations of credit exposure by
industry, product, geography and customer relationship. Distribution of
loans and leases by loan size is an additional measure of the portfolio risk
diversification. We also review, measure, and manage commercial real
estate loans by geographic location and property type. In addition, within
our international portfolio, we evaluate borrowings by region and by coun-
try. Tables 19, 21, 24 and 25 summarize our concentrations. Additionally,
we utilize syndication of exposure to third parties, loan sales, hedging and
other risk mitigation techniques to manage the size and risk profile of the
loan portfolio.
74
Bank of America 2007