Bank of America 2007 Annual Report Download - page 39
Download and view the complete annual report
Please find page 39 of the 2007 Bank of America annual report below. You can navigate through the pages in the report by either clicking on the pages listed below, or by using the keyword search tool below to find specific information within the annual report.-
 1
1 -
2
-
3
-
4
-
5
-
6
-
7
-
8
-
9
-
10
-
11
-
12
-
13
-
14
-
15
-
16
-
17
-
18
-
19
-
20
-
21
-
22
-
23
-
24
-
25
-
26
-
27
-
28
-
 29
29 -
 30
30 -
 31
31 -
 32
32 -
 33
33 -
 34
34 -
 35
35 -
 36
36 -
 37
37 -
 38
38 -
 39
39 -
 40
40 -
 41
41 -
 42
42 -
 43
43 -
 44
44 -
 45
45 -
 46
46 -
 47
47 -
 48
48 -
 49
49 -
50
-
51
-
52
-
53
-
54
-
55
-
56
-
57
-
58
-
59
-
60
-
61
-
62
-
63
-
64
-
65
-
66
-
67
-
68
-
69
-
70
-
71
-
72
-
73
-
74
-
75
-
76
-
77
-
78
-
79
-
80
-
81
-
82
-
83
-
84
-
85
-
86
-
87
-
88
-
89
-
90
-
91
-
92
-
93
-
94
-
95
-
96
-
97
-
98
-
99
-
100
-
101
-
102
-
103
-
104
-
105
-
106
-
107
-
108
-
109
-
110
-
111
-
112
-
113
-
114
-
115
-
116
-
117
-
118
-
119
-
120
-
121
-
122
-
123
-
124
-
125
-
126
-
127
-
128
-
129
-
130
-
131
-
132
-
133
-
134
-
135
-
136
-
137
-
138
-
139
-
140
-
141
-
142
-
143
-
144
-
145
-
146
-
147
-
148
-
149
-
150
-
151
-
152
-
153
-
154
-
155
-
156
-
157
-
158
-
159
-
160
-
161
-
162
-
163
-
164
-
165
-
166
-
167
-
168
-
169
-
170
-
171
-
172
-
173
-
174
-
175
-
176
-
177
-
178
-
179
 |
 |

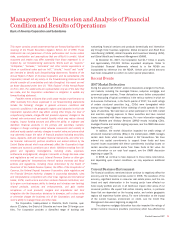
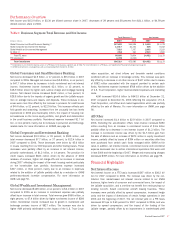
Performance Overview
Net income was $15.0 billion, or $3.30 per diluted common share in 2007, decreases of 29 percent and 28 percent from $21.1 billion, or $4.59 per
diluted common share in 2006.
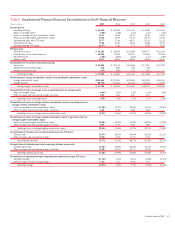
Table 1 Business Segment Total Revenue and Net Income
Total Revenue
(1)
Net Income
(Dollars in millions) 2007 2006 2007 2006
Global Consumer and Small Business Banking
(2)
$47,682
$44,926
$ 9,430
$11,378
Global Corporate and Investment Banking
13,417
21,161
538
6,032
Global Wealth and Investment Management
7,923
7,357
2,095
2,223
All Other
(2)
(954)
360
2,919
1,500
Total FTE basis
68,068
73,804
14,982
21,133
FTE adjustment
(1,749)
(1,224)
–
–
Total Consolidated
$66,319
$72,580
$14,982
$21,133
(1) Total revenue is net of interest expense, and is on a FTE basis for the business segments and All Other. For more information on a FTE basis, see Supplemental Financial Data beginning on page 42.
(2) GCSBB is presented on a managed basis with a corresponding offset recorded in All Other.
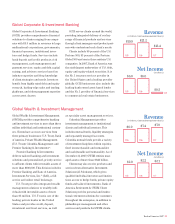
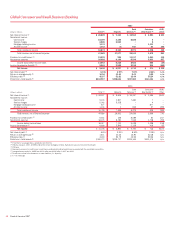
Global Consumer and Small Business Banking
Net income decreased $1.9 billion, or 17 percent, to $9.4 billion in 2007
compared to 2006. Managed net revenue rose $2.8 billion, or six percent,
to $47.7 billion driven by increases in both noninterest and net interest
income. Noninterest income increased $2.1 billion, or 13 percent, to
$18.9 billion driven by higher card, service charge and mortgage banking
income. Net interest income increased $612 million, or two percent, to
$28.8 billion due to the impacts of organic growth and the LaSalle acquis-
ition on average loans and leases, and deposits. These increases in rev-
enues were more than offset by the increase in provision for credit losses
of $4.4 billion, or 51 percent, to $12.9 billion. This increase reflects port-
folio growth and seasoning, increases from the unusually low loss levels
experienced in 2006 post bankruptcy reform, the impact of housing mar-
ket weakness on the home equity portfolio, and growth and deterioration
in the small business portfolio. Noninterest expense increased $1.7 bil-
lion, or nine percent, mainly due to increases in personnel and technology-
related costs. For more information on GCSBB, see page 46.
Global Corporate and Investment Banking
Net income decreased $5.5 billion, or 91 percent, to $538 million, and
total revenue decreased $7.7 billion, or 37 percent, to $13.4 billion in
2007 compared to 2006. These decreases were driven by $5.6 billion
in losses resulting from our CDO exposure and other trading losses. These
decreases were partially offset by an increase in net interest income,
primarily market-based, of $1.3 billion, or 14 percent. The provision for
credit losses increased $643 million driven by the absence of 2006
releases of reserves, higher net charge-offs and an increase in reserves
during 2007 reflecting the impact of the weak housing market particularly
on the homebuilder loan portfolio. Noninterest expense increased
$347 million, or three percent, mainly due to an increase in expenses
related to the addition of LaSalle partially offset by a reduction in CMAS
performance-based incentive compensation. For more information on
GCIB, see page 50.
Global Wealth and Investment Management
Net income decreased $128 million, or six percent, to $2.1 billion in 2007
compared to 2006 as an increase in noninterest expense was partially
offset by an increase in total revenue. Total revenue grew $566 million, or
eight percent, to $7.9 billion driven by higher noninterest income of $380
million. Noninterest income increased due to growth in investment and
brokerage services income of $827 million. The increase was due to
higher AUM primarily attributable to the impact of the U.S. Trust Corpo-
ration acquisition, net client inflows and favorable market conditions
combined with an increase in brokerage activity. This increase was parti-
ally offset by a decrease in all other income of $447 million due to losses
of $382 million associated with the support provided to certain cash
funds. Noninterest expense increased $768 million driven by the addition
of U.S. Trust Corporation, higher revenue-related expenses and marketing
costs.
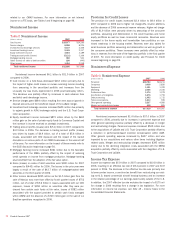
AUM increased $100.6 billion to $643.5 billion at December 31,
2007 compared to December 31, 2006 reflecting the acquisition of U.S.
Trust Corporation, net inflows and market appreciation which was partially
offset by the sale of Marsico. For more information on GWIM, see page
56.
All Other
Net income increased $1.4 billion to $2.9 billion in 2007 compared to
2006. Excluding the securitization offset, total revenue increased $283
million resulting from an increase in noninterest income of $1.6 billion
partially offset by a decrease in net interest income of $1.3 billion. The
increase in noninterest income was driven by the $1.5 billion gain from
the sale of Marsico and an increase of $873 million in equity investment
income, partially offset by losses of $394 million on securities after they
were purchased from certain cash funds managed within GWIM at fair
value. In addition, net interest income, noninterest income and noninterest
expense decreased due to certain international operations that were sold
in late 2006 and the beginning of 2007. Merger and restructuring charges
decreased $395 million. For more information on All Other, see page 59.
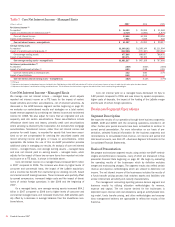
Financial Highlights
Net Interest Income
Net interest income on a FTE basis increased $367 million to $36.2 bil-
lion for 2007 compared to 2006. The increase was driven by the con-
tribution from market-based net interest income related to our CMAS
business, higher levels of consumer and commercial loans, the impact of
the LaSalle acquisition, and a one-time tax benefit from restructuring our
existing non-U.S. based commercial aircraft leasing business. These
increases were partially offset by spread compression, increased hedge
costs and the impact of divestitures of certain foreign operations in late
2006 and the beginning of 2007. The net interest yield on a FTE basis
decreased 22 bps to 2.60 percent for 2007 compared to 2006, and was
driven by spread compression, and the impact of the funding of the
LaSalle merger, partially offset by an improvement in market-based yield
Bank of America 2007
37