Bank of America 2007 Annual Report Download - page 140
Download and view the complete annual report
Please find page 140 of the 2007 Bank of America annual report below. You can navigate through the pages in the report by either clicking on the pages listed below, or by using the keyword search tool below to find specific information within the annual report.-
 1
1 -
2
-
3
-
4
-
5
-
6
-
7
-
8
-
9
-
10
-
11
-
12
-
13
-
14
-
15
-
16
-
17
-
18
-
19
-
20
-
21
-
22
-
23
-
24
-
25
-
26
-
27
-
28
-
29
-
30
-
31
-
32
-
33
-
34
-
35
-
36
-
37
-
38
-
39
-
40
-
41
-
42
-
43
-
44
-
45
-
46
-
47
-
48
-
49
-
50
-
51
-
52
-
53
-
54
-
55
-
56
-
57
-
58
-
59
-
60
-
61
-
62
-
63
-
64
-
65
-
66
-
67
-
68
-
69
-
70
-
71
-
72
-
73
-
74
-
75
-
76
-
77
-
78
-
79
-
80
-
81
-
82
-
83
-
84
-
85
-
86
-
87
-
88
-
89
-
90
-
91
-
92
-
93
-
94
-
95
-
96
-
97
-
98
-
99
-
100
-
101
-
102
-
103
-
104
-
105
-
106
-
107
-
108
-
109
-
110
-
111
-
112
-
113
-
114
-
115
-
116
-
117
-
118
-
119
-
120
-
121
-
122
-
123
-
124
-
125
-
126
-
127
-
128
-
129
-
 130
130 -
 131
131 -
 132
132 -
 133
133 -
 134
134 -
 135
135 -
 136
136 -
 137
137 -
 138
138 -
 139
139 -
 140
140 -
 141
141 -
 142
142 -
 143
143 -
 144
144 -
 145
145 -
 146
146 -
 147
147 -
 148
148 -
 149
149 -
 150
150 -
151
-
152
-
153
-
154
-
155
-
156
-
157
-
158
-
159
-
160
-
161
-
162
-
163
-
164
-
165
-
166
-
167
-
168
-
169
-
170
-
171
-
172
-
173
-
174
-
175
-
176
-
177
-
178
-
179
 |
 |

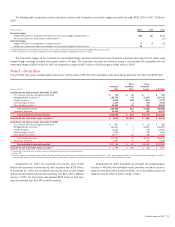
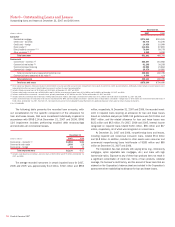
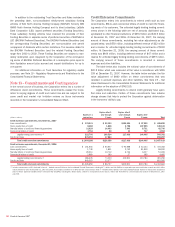
Note 9 – Variable Interest Entities
The following table presents total assets of those VIEs in which the Corporation holds a significant variable interest and, in the unlikely event that all of the
assets in the VIEs become worthless, the Corporation’s maximum exposure to loss. The Corporation’s maximum exposure to loss incorporates not only
potential losses associated with assets recorded on the Corporation’s balance sheet but also off-balance sheet commitments, such as unfunded liquidity
and lending commitments and other contractual arrangements.
Consolidated
(1)
Unconsolidated
(Dollars in millions) Total Assets Loss Exposure Total Assets Loss Exposure
Variable interest entities, December 31, 2007
Corporation-sponsored multi-seller conduits
$11,944 $16,984 $29,363 $47,335
Collateralized debt obligation vehicles
4,464 4,311 8,324 7,410
Leveraged lease trusts
6,236 6,236 – –
Other
13,771 12,347 8,260 5,953
Total variable interest entities
$36,415 $39,878 $45,947 $60,698
Variable interest entities, December 31, 2006
Corporation-sponsored multi-seller conduits $ 9,090 $11,515 $18,983 $29,836
Collateralized debt obligation vehicles – – 8,489 7,658
Leveraged lease trusts 8,575 8,575 – –
Other 4,717 3,019 12,709 9,310
Total variable interest entities $22,382 $23,109 $40,181 $46,804
(1) The Corporation consolidates VIEs when it is the primary beneficiary that will absorb the majority of the expected losses or expected residual returns of the VIEs or both.
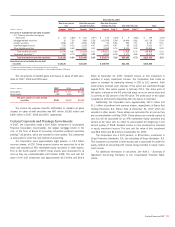
Corporation-Sponsored Multi-seller Conduits
The Corporation administers three multi-seller conduits which provide a
low-cost funding alternative to its customers by facilitating their access to
the commercial paper market. These customers sell or otherwise transfer
assets to the conduits, which in turn issue high-grade, short-term commer-
cial paper that is collateralized by the underlying assets. The Corporation
receives fees for providing combinations of liquidity and SBLCs or similar
loss protection commitments to the conduits.
At December 31, 2007, our liquidity commitments to the conduits
were collateralized by various classes of assets. Assets held in the con-
duits incorporate features such as overcollateralization and cash reserves
which are designed to provide credit support at a level that is equivalent to
investment grade as determined in accordance with internal risk rating
guidelines. During 2007, there were no material write-downs or down-
grades of assets.
The Corporation is the primary beneficiary of one conduit which is
included in the Consolidated Financial Statements. The assets of the
consolidated conduit are recorded in AFS and held-to-maturity debt secu-
rities, and other assets. At December 31, 2007, the Corporation’s liquidity
commitments to the conduit were collateralized by credit card loans (21
percent), auto loans (14 percent), equipment loans (13 percent), and
student loans (eight percent). None of these assets are subprime resi-
dential mortgages. In addition, 29 percent of the Corporation’s liquidity
commitments were collateralized by projected cash flows from long-term
contracts (e.g., television broadcast contracts, stadium revenues and roy-
alty payments) which, as mentioned above, incorporate features that pro-
vide credit support at a level equivalent to investment grade. Assets of the
Corporation are not available to pay creditors of the consolidated conduit,
except to the extent the Corporation may be obligated to perform under
the liquidity commitments and SBLCs. Assets of the consolidated conduit
are not available to pay creditors of the Corporation.
The Corporation does not consolidate the other two conduits which
issued capital notes and equity interests to independent third parties as it
does not expect to absorb a majority of the variability of the conduits. At
December 31, 2007, the Corporation’s liquidity commitments to the
unconsolidated conduits were collateralized by student loans (27 percent),
credit card loans and trade receivables (10 percent each), and auto loans
(eight percent). Less than one percent of these assets are subprime
residential mortgages. In addition, 29 percent of the Corporation’s
commitments were collateralized by the conduits’ short-term lending
arrangements with investment funds, primarily real estate funds, which, as
mentioned above, incorporate features that provide credit support at a
level equivalent to investment grade. Amounts advanced under these
arrangements will be repaid when the investment funds issue capital calls
to their qualified equity investors.
Net revenues earned from fees associated with these commitments
were $184 million and $121 million in 2007 and 2006.
Collateralized Debt Obligation Vehicles
CDO vehicles are SPEs that hold diversified pools of fixed income secu-
rities. They issue multiple tranches of debt securities, including commer-
cial paper, and equity securities. The Corporation receives fees for
structuring the CDOs and/or placing debt securities with third party invest-
ors. The Corporation provided total liquidity support to CDO vehicles of
$12.3 billion and $7.7 billion notional amount at December 31, 2007 and
2006 consisting of $10.0 billion (including $3.2 billion for a consolidated
CDO) and $2.1 billion of written put options and $2.3 billion and $5.5 bil-
lion of other liquidity support at December 31, 2007 and 2006.
The Corporation is the primary beneficiary of certain CDOs which are
included in the Consolidated Financial Statements at December 31, 2007.
Assets held in the consolidated CDOs are classified in trading account
assets and AFS debt securities, including AFS debt securities with a fair
value of $2.8 billion that were principally related to certain assets that
were removed from the CDO conduit discussed below. The creditors of the
consolidated CDOs have no recourse to the general credit of the Corpo-
ration.
At December 31, 2007 and 2006, the Corporation provided liquidity
support in the form of written put options on $10.0 billion and $2.1 billion
notional amount of commercial paper issued by CDOs including $3.2 bil-
lion issued by a consolidated CDO at December 31, 2007. The commer-
cial paper is the most senior class of securities issued by the CDOs and
benefits from the subordination of all other securities, including AAA-rated
securities, issued by the CDOs. The Corporation is obligated under the
written put options to provide funding to the CDOs by purchasing the
commercial paper at predetermined contractual yields in the event of a
severe disruption in the short-term funding market. These written put
138
Bank of America 2007