Bank of America 2007 Annual Report Download - page 79
Download and view the complete annual report
Please find page 79 of the 2007 Bank of America annual report below. You can navigate through the pages in the report by either clicking on the pages listed below, or by using the keyword search tool below to find specific information within the annual report.-
 1
1 -
2
-
3
-
4
-
5
-
6
-
7
-
8
-
9
-
10
-
11
-
12
-
13
-
14
-
15
-
16
-
17
-
18
-
19
-
20
-
21
-
22
-
23
-
24
-
25
-
26
-
27
-
28
-
29
-
30
-
31
-
32
-
33
-
34
-
35
-
36
-
37
-
38
-
39
-
40
-
41
-
42
-
43
-
44
-
45
-
46
-
47
-
48
-
49
-
50
-
51
-
52
-
53
-
54
-
55
-
56
-
57
-
58
-
59
-
60
-
61
-
62
-
63
-
64
-
65
-
66
-
67
-
68
-
 69
69 -
 70
70 -
 71
71 -
 72
72 -
 73
73 -
 74
74 -
 75
75 -
 76
76 -
 77
77 -
 78
78 -
 79
79 -
 80
80 -
 81
81 -
 82
82 -
 83
83 -
 84
84 -
 85
85 -
 86
86 -
 87
87 -
 88
88 -
 89
89 -
90
-
91
-
92
-
93
-
94
-
95
-
96
-
97
-
98
-
99
-
100
-
101
-
102
-
103
-
104
-
105
-
106
-
107
-
108
-
109
-
110
-
111
-
112
-
113
-
114
-
115
-
116
-
117
-
118
-
119
-
120
-
121
-
122
-
123
-
124
-
125
-
126
-
127
-
128
-
129
-
130
-
131
-
132
-
133
-
134
-
135
-
136
-
137
-
138
-
139
-
140
-
141
-
142
-
143
-
144
-
145
-
146
-
147
-
148
-
149
-
150
-
151
-
152
-
153
-
154
-
155
-
156
-
157
-
158
-
159
-
160
-
161
-
162
-
163
-
164
-
165
-
166
-
167
-
168
-
169
-
170
-
171
-
172
-
173
-
174
-
175
-
176
-
177
-
178
-
179
 |
 |

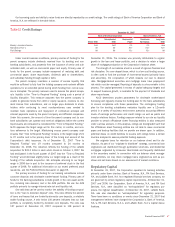
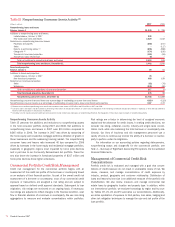
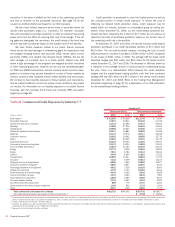
Table 18 Commercial Utilized Criticized Exposure (1, 2)
December 31, 2007 December 31, 2006
(Dollars in millions) Amount Percent
(3)
Amount Percent
(3)
Commercial – domestic
(4)
$ 8,829 3.37%
$4,803 2.39%
Commercial real estate
6,825 10.35
806 1.98
Commercial lease financing
594 2.63
504 2.31
Commercial – foreign
509 0.98
571 1.32
16,757 4.16
6,684 2.18
Small business commercial – domestic
796 4.46
377 2.72
Total commercial utilized criticized exposure
$17,553 4.17
$7,061 2.20
(1) Criticized exposure corresponds to the Special Mention, Substandard and Doubtful asset categories defined by regulatory authorities. Balances and ratios have been adjusted to exclude assets held-for-sale at December 31,
2007 and 2006 and exposure measured at fair value in accordance with SFAS 159 at December 31, 2007. Had criticized exposure in the assets held-for-sale and fair value portfolios been included, the ratio of commercial
utilized criticized exposure to total commercial utilized exposure would have been 4.77 percent and 2.23 percent at December 31, 2007 and 2006.
(2) Exposure includes standby letters of credit, financial guarantees, commercial letters of credit and bankers’ acceptances for which the bank is legally bound to advance funds under prescribed conditions, during a specified
period. Although funds have not been advanced, these exposure types are considered utilized for credit risk management purposes.
(3) Ratios are calculated as commercial utilized criticized exposure divided by total commercial utilized exposure for each exposure category.
(4) Excludes small business commercial – domestic exposure.
Table 18 presents commercial utilized criticized exposure by product
type and as a percentage of total commercial utilized exposure. Commer-
cial utilized criticized exposure increased $10.5 billion, or 149 percent,
primarily due to increases in commercial real estate and commercial –
domestic of which LaSalle contributed $5.1 billion as discussed in more
detail in the product sections below. The table above excludes utilized
criticized exposure related to assets held-for-sale of $2.9 billion and $600
million at December 31, 2007 and 2006 and other utilized criticized
exposure measured at fair value in accordance with SFAS 159 of $1.1 bil-
lion at December 31, 2007. See Note 19 – Fair Value Disclosures to the
Consolidated Financial Statements for a discussion of the fair value portfo-
lio. Criticized assets in the held-for-sale portfolio, are carried at the lower
of cost or market, including bridge exposure of $2.3 billion and $550 mil-
lion at December 31, 2007 and 2006 which funded in the normal course
of our Business Lending and CMAS businesses and are managed in part
through our “originate to distribute” strategy (see Management of
Commercial Credit Risk Concentrations beginning on page 74 for more
information on bridge financing). The level of funded, criticized bridge
exposures in the held-for-sale portfolio increased as a result of adverse
market conditions in the second half of 2007. Had criticized exposure in
the assets held-for-sale and fair value portfolios been included, the ratio of
commercial utilized criticized exposure to total commercial utilized
exposure would have been 4.77 percent and 2.23 percent at
December 31, 2007 and 2006.
Commercial – Domestic
At December 31, 2007, approximately 89 percent of the commercial –
domestic portfolio, excluding small business, was included in Business
Lending (business banking, middle market and large multinational corpo-
rate loans and leases) and CMAS (acquisition and bridge financing). The
remaining 11 percent was mostly in GWIM (business-purpose loans for
wealthy individuals). Outstanding commercial – domestic loans and leases
including loans measured at fair value, increased $45.8 billion to $194.0
billion at December 31, 2007 compared to December 31, 2006 driven
primarily by an increase in loans within GCIB related to the addition of
LaSalle and organic growth. Nonperforming commercial – domestic loans
increased by $364 million to $869 million primarily driven by the addition
of LaSalle. Net charge-offs were up $163 million from 2006 driven primar-
ily by a lower level of recoveries. Criticized utilized commercial – domestic
exposure excluding assets in the held-for-sale and fair value portfolios,
increased $4.0 billion to $8.8 billion primarily driven by the addition of
LaSalle, higher exposure to mortgage lenders and asset-based lending.
Commercial Real Estate
The commercial real estate portfolio is mostly managed in Business Lend-
ing and consists of loans issued primarily to public and private developers,
homebuilders and commercial real estate firms. Outstanding loans and
leases, including loans measured at fair value, increased $25.3 billion to
$61.6 billion at December 31, 2007 compared to 2006. The increase was
related to the acquisition of LaSalle, which increased outstandings by
approximately $18.8 billion, and organic growth. The portfolio remains
diversified across property types and geographic regions with increases in
Illinois, the Midwest and California largely related to the addition of
LaSalle. Organic growth was strong in the Northeast and in retail, office
and apartment property types. The addition of LaSalle contributed to
growth in residential and broadly across all other property types.
Nonperforming commercial real estate loans increased $981 million
to $1.1 billion and utilized criticized exposure increased $6.0 billion to
$6.8 billion attributable to the continuing impact of the housing slowdown
on the homebuilding sector as well as the addition of LaSalle. Non-
performing loans and utilized criticized exposure in the homebuilding sec-
tor were $792 million and $5.4 billion, respectively, at December 31,
2007 compared to $71 million and $348 million at December 31, 2006.
Net charge-offs were up $44 million from 2006 principally related to the
homebuilder sector of the portfolio. At December 31, 2007, we had
homebuilder-related exposure of $13.6 billion in loans and $21.6 billion in
commercial committed exposure, of which 39 percent was criticized and
six percent was classified as nonperforming. Assets held-for-sale asso-
ciated with commercial real estate increased $8.6 billion to $13.8 billion
at December 31, 2007 compared to 2006, driven by reduced market liq-
uidity resulting in a higher level of warehoused assets pending commercial
mortgage-backed securitizations and the addition of LaSalle. Refer to
Management of Commercial Credit Risk Concentrations on page 74 for a
discussion of our CMBS exposure.
Bank of America 2007
77