Bank of America 2007 Annual Report Download - page 85
Download and view the complete annual report
Please find page 85 of the 2007 Bank of America annual report below. You can navigate through the pages in the report by either clicking on the pages listed below, or by using the keyword search tool below to find specific information within the annual report.-
 1
1 -
2
-
3
-
4
-
5
-
6
-
7
-
8
-
9
-
10
-
11
-
12
-
13
-
14
-
15
-
16
-
17
-
18
-
19
-
20
-
21
-
22
-
23
-
24
-
25
-
26
-
27
-
28
-
29
-
30
-
31
-
32
-
33
-
34
-
35
-
36
-
37
-
38
-
39
-
40
-
41
-
42
-
43
-
44
-
45
-
46
-
47
-
48
-
49
-
50
-
51
-
52
-
53
-
54
-
55
-
56
-
57
-
58
-
59
-
60
-
61
-
62
-
63
-
64
-
65
-
66
-
67
-
68
-
69
-
70
-
71
-
72
-
73
-
74
-
 75
75 -
 76
76 -
 77
77 -
 78
78 -
 79
79 -
 80
80 -
 81
81 -
 82
82 -
 83
83 -
 84
84 -
 85
85 -
 86
86 -
 87
87 -
 88
88 -
 89
89 -
 90
90 -
 91
91 -
 92
92 -
 93
93 -
 94
94 -
 95
95 -
96
-
97
-
98
-
99
-
100
-
101
-
102
-
103
-
104
-
105
-
106
-
107
-
108
-
109
-
110
-
111
-
112
-
113
-
114
-
115
-
116
-
117
-
118
-
119
-
120
-
121
-
122
-
123
-
124
-
125
-
126
-
127
-
128
-
129
-
130
-
131
-
132
-
133
-
134
-
135
-
136
-
137
-
138
-
139
-
140
-
141
-
142
-
143
-
144
-
145
-
146
-
147
-
148
-
149
-
150
-
151
-
152
-
153
-
154
-
155
-
156
-
157
-
158
-
159
-
160
-
161
-
162
-
163
-
164
-
165
-
166
-
167
-
168
-
169
-
170
-
171
-
172
-
173
-
174
-
175
-
176
-
177
-
178
-
179
 |
 |
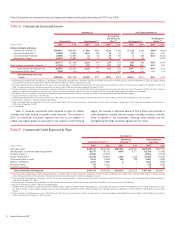
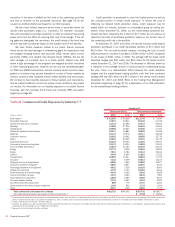
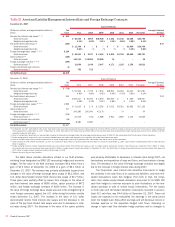
The increased exposures in Mexico were attributable to higher cross-
border corporate securities trading exposure and loans and loan commit-
ments. Our 24.9 percent investment in Santander accounted for $2.6
billion and $2.3 billion of exposure in Mexico at December 31, 2007 and
2006.
At both December 31, 2007 and 2006, five percent of the emerging
markets exposure was in Middle East and Africa. Middle East and Africa
emerging markets exposure increased by $825 million driven by higher
cross-border other financing exposure and loans and loan commitments.
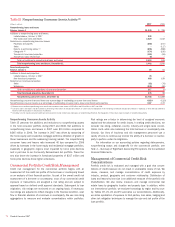
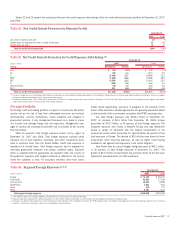
Provision for Credit Losses
The provision for credit losses increased $3.4 billion, or 67 percent, to
$8.4 billion in 2007 compared to 2006.
The consumer portion of the provision for credit losses increased
$1.8 billion to $6.5 billion compared to 2006. Higher net charge-offs from
portfolio seasoning, reflective of growth in the businesses and increases
from the unusually low charge-off levels experienced in 2006 post bank-
ruptcy reform drove a portion of the increase. Additionally, reserve
increases related to higher losses inherent in our home equity portfolio,
reflecting growth in the business and the impact of the weak housing
market, as well as seasoning of the Card Services consumer portfolios
contributed to the increased provision expense. The increases were parti-
ally offset by reserve reductions from the addition of higher loss profile
accounts to the domestic credit card securitization trust and to a lesser
extent, improved performance of the remaining portfolios from certain
consumer finance businesses that we have previously exited.
The commercial portion of the provision for credit losses increased
$1.6 billion to $1.9 billion compared to 2006. Higher net charge-offs from
seasoning and deterioration in our small business portfolios within GCSBB
as well as a lower level of commercial recoveries in GCIB and GWIM drove
a portion of the increase. Reserve increases for seasoning of growth and
deterioration in the small business portfolio within GCSBB, the absence of
prior year reserve releases in GCIB and portfolio deterioration reflecting
the impact of the weak housing market, particularly on our homebuilder
loan portfolio within GCIB, also drove the year over year increase. Partially
offsetting these increases was a reduction of reserves in All Other reflect-
ing the sale of our Argentina portfolio during the first quarter of 2007.
The provision for credit losses related to unfunded lending commit-
ments was $28 million in 2007 compared to $9 million in 2006.
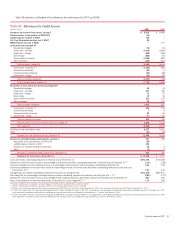
Allowance for Credit Losses
Allowance for Loan and Lease Losses
The allowance for loan and lease losses excludes loans measured at fair
value in accordance with SFAS 159 as subsequent mark-to-market adjust-
ments related to loans measured at fair value include a credit risk compo-
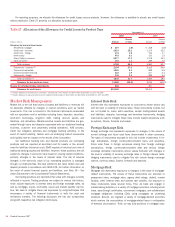
nent. The allowance for loan and lease losses is allocated based on two
components. We evaluate the adequacy of the allowance for loan and
lease losses based on the combined total of these two components.
The first component of the allowance for loan and lease losses cov-
ers those commercial loans measured at historical cost that are either
nonperforming or impaired. An allowance is allocated when the discounted
cash flows (or collateral value or observable market price) are lower than
the carrying value of that loan. For purposes of computing the specific loss
component of the allowance, larger impaired loans are evaluated
individually and smaller impaired loans are evaluated as a pool using his-
torical loss experience for the respective product type and risk rating of
the loans.
The second component of the allowance for loan and lease losses
covers performing consumer and commercial loans and leases measured
at historical cost. The allowance for commercial loan and lease losses is
established by product type after analyzing historical loss experience by
internal risk rating, current economic conditions, industry performance
trends, geographic or obligor concentrations within each portfolio segment,
and any other pertinent information. The commercial historical loss experi-
ence is updated quarterly to incorporate the most recent data reflective of
the current economic environment. As of December 31, 2007, quarterly
updating of historical loss experience did not have a material impact on
the allowance for loan and lease losses. The allowance for consumer and
certain homogeneous commercial loan and lease products is based on
aggregated portfolio segment evaluations, generally by product type. Loss
forecast models are utilized that consider a variety of factors including, but
not limited to, historical loss experience, estimated defaults or fore-
closures based on portfolio trends, delinquencies, economic trends and
credit scores. These loss forecast models are updated on a quarterly
basis in order to incorporate information reflective of the current economic
environment. As of December 31, 2007, quarterly updating of the loss
forecast models resulted in increases in the allowance for loan and lease
losses primarily due to growth and seasoning of the consumer portfolios
and higher inherent losses in the home equity and small business portfo-
lios. Included within this second component of the allowance for loan and
lease losses and determined separately from the procedures outlined
above are reserves which are maintained to cover uncertainties that affect
our estimate of probable losses including domestic and global economic
uncertainty and large single name defaults.
We monitor differences between estimated and actual incurred loan
and lease losses. This monitoring process includes periodic assessments
by senior management of loan and lease portfolios and the models used
to estimate incurred losses in those portfolios.
Additions to the allowance for loan and lease losses are made by
charges to the provision for credit losses. Credit exposures deemed to be
uncollectible are charged against the allowance for loan and lease losses.
Recoveries of previously charged off amounts are credited to the allow-
ance for loan and lease losses.
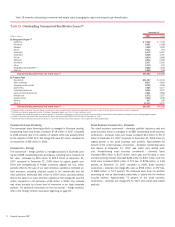
The allowance for loan and lease losses for the consumer portfolio
as presented in Table 27 was $6.8 billion at December 31, 2007, an
increase of $1.2 billion from December 31, 2006. The increase was
attributable to an increase in reserves during 2007 for higher losses
inherent in our home equity portfolio reflective of the impact of the weak
housing market as well as growth and seasoning of the Card Services
consumer portfolios. These increases were partially offset by reserve
reductions from the addition of higher loss profile accounts to the domes-
tic credit card securitizations trust, net new issuances of securitizations,
and improved performance of the remaining portfolios from certain
consumer finance businesses that we have previously exited.
The allowance for commercial loan and lease losses was $4.8 billion
at December 31, 2007, a $1.4 billion increase from December 31, 2006.
The LaSalle acquisition increased the allowance for commercial loan and
lease losses $676 million. In addition, the increase in commercial –
domestic allowance levels was primarily attributable to an increase in
reserves for higher losses inherent in the small business portfolio within
GCSBB. Commercial real estate allowance levels increased mainly due to
the LaSalle acquisition and portfolio deterioration reflecting the impact of
the weak housing market, particularly on our homebuilder loan portfolio
within GCIB. Commercial – foreign allowance levels decreased due to the
sales of our Latin American portfolios and operations.
Bank of America 2007
83