Bank of America 2007 Annual Report Download - page 110
Download and view the complete annual report
Please find page 110 of the 2007 Bank of America annual report below. You can navigate through the pages in the report by either clicking on the pages listed below, or by using the keyword search tool below to find specific information within the annual report.-
 1
1 -
2
-
3
-
4
-
5
-
6
-
7
-
8
-
9
-
10
-
11
-
12
-
13
-
14
-
15
-
16
-
17
-
18
-
19
-
20
-
21
-
22
-
23
-
24
-
25
-
26
-
27
-
28
-
29
-
30
-
31
-
32
-
33
-
34
-
35
-
36
-
37
-
38
-
39
-
40
-
41
-
42
-
43
-
44
-
45
-
46
-
47
-
48
-
49
-
50
-
51
-
52
-
53
-
54
-
55
-
56
-
57
-
58
-
59
-
60
-
61
-
62
-
63
-
64
-
65
-
66
-
67
-
68
-
69
-
70
-
71
-
72
-
73
-
74
-
75
-
76
-
77
-
78
-
79
-
80
-
81
-
82
-
83
-
84
-
85
-
86
-
87
-
88
-
89
-
90
-
91
-
92
-
93
-
94
-
95
-
96
-
97
-
98
-
99
-
 100
100 -
 101
101 -
 102
102 -
 103
103 -
 104
104 -
 105
105 -
 106
106 -
 107
107 -
 108
108 -
 109
109 -
 110
110 -
 111
111 -
 112
112 -
 113
113 -
 114
114 -
 115
115 -
 116
116 -
 117
117 -
 118
118 -
 119
119 -
 120
120 -
121
-
122
-
123
-
124
-
125
-
126
-
127
-
128
-
129
-
130
-
131
-
132
-
133
-
134
-
135
-
136
-
137
-
138
-
139
-
140
-
141
-
142
-
143
-
144
-
145
-
146
-
147
-
148
-
149
-
150
-
151
-
152
-
153
-
154
-
155
-
156
-
157
-
158
-
159
-
160
-
161
-
162
-
163
-
164
-
165
-
166
-
167
-
168
-
169
-
170
-
171
-
172
-
173
-
174
-
175
-
176
-
177
-
178
-
179
 |
 |

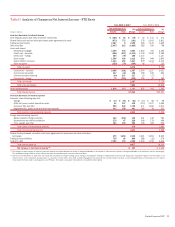
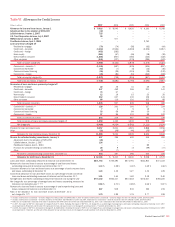
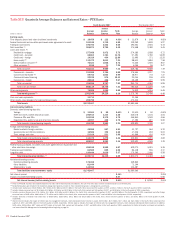
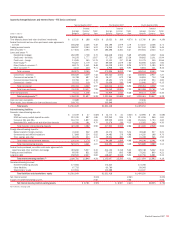
Table XIII Quarterly Average Balances and Interest Rates – FTE Basis
Fourth Quarter 2007 Third Quarter 2007
(Dollars in millions)
Average
Balance
Interest
Income/
Expense
Yield/
Rate
Average
Balance
Interest
Income/
Expense
Yield/
Rate
Earning assets
Time deposits placed and other short-term investments
$ 10,459 $ 122 4.63%
$ 11,879 $ 148 4.92%
Federal funds sold and securities purchased under agreements to resell
151,938 1,748 4.59
139,259 1,839 5.27
Trading account assets
190,700 2,422 5.06
194,661 2,604 5.33
Debt securities
(1)
206,873 2,795 5.40
174,568 2,380 5.45
Loans and leases
(2)
:
Residential mortgage
277,058 3,972 5.73
274,385 3,928 5.72
Credit card – domestic
60,063 1,781 11.76
57,491 1,780 12.29
Credit card – foreign
14,329 464 12.86
11,995 371 12.25
Home equity
(3)
112,372 2,043 7.21
98,611 1,884 7.58
Direct/Indirect consumer
(4)
75,423 1,658 8.72
73,245 1,600 8.67
Other consumer
(5)
3,918 71 7.24
4,055 96 9.47
Total consumer
543,163 9,989 7.32
519,782 9,659 7.39
Commercial – domestic
213,200 3,704 6.89
176,554 3,207 7.21
Commercial real estate
(6)
59,702 1,053 6.99
38,977 733 7.47
Commercial lease financing
22,239 574 10.33
20,044 246 4.91
Commercial – foreign
29,815 426 5.67
25,159 377 5.95
Total commercial
324,956 5,757 7.03
260,734 4,563 6.95
Total loans and leases
868,119 15,746 7.21
780,516 14,222 7.25
Other earning assets
74,909 1,296 6.89
74,912 1,215 6.46
Total earning assets (7)
1,502,998 24,129 6.39
1,375,795 22,408 6.48
Cash and cash equivalents
33,714
31,356
Other assets, less allowance for loan and lease losses
205,755
173,414
Total assets
$1,742,467
$1,580,565
Interest-bearing liabilities
Domestic interest-bearing deposits:
Savings
$ 31,961 $ 50 0.63%
$ 31,510 $ 50 0.62%
NOW and money market deposit accounts
240,914 1,334 2.20
215,078 1,104 2.04
Consumer CDs and IRAs
183,910 2,179 4.70
165,840 1,949 4.66
Negotiable CDs, public funds and other time deposits
34,997 420 4.76
17,392 227 5.20
Total domestic interest-bearing deposits
491,782 3,983 3.21
429,820 3,330 3.07
Foreign interest-bearing deposits:
Banks located in foreign countries
45,050 557 4.91
43,727 564 5.12
Governments and official institutions
16,506 192 4.62
17,206 218 5.03
Time, savings and other
51,919 521 3.98
41,868 433 4.09
Total foreign interest-bearing deposits
113,475 1,270 4.44
102,801 1,215 4.69
Total interest-bearing deposits
605,257 5,253 3.44
532,621 4,545 3.39
Federal funds purchased, securities sold under agreements to repurchase and
other short-term borrowings
456,530 5,599 4.87
409,070 5,521 5.36
Trading account liabilities
81,500 825 4.02
86,118 906 4.17
Long-term debt
196,444 2,638 5.37
175,265 2,446 5.58
Total interest-bearing liabilities (7)
1,339,731 14,315 4.25
1,203,074 13,418 4.43
Noninterest-bearing sources:
Noninterest-bearing deposits
176,368
169,860
Other liabilities
81,444
73,144
Shareholders’ equity
144,924
134,487
Total liabilities and shareholders’ equity
$1,742,467
$1,580,565
Net interest spread
2.14%
2.05%
Impact of noninterest-bearing sources
0.47
0.56
Net interest income/yield on earning assets
$ 9,814 2.61%
$ 8,990 2.61%
(1) Yields on AFS debt securities are calculated based on fair value rather than historical cost balances. The use of fair value does not have a material impact on net interest yield.
(2) Nonperforming loans are included in the respective average loan balances. Income on these nonperforming loans is recognized on a cash basis.
(3) Includes home equity loans of $20.9 billion, $16.7 billion, $15.6 billion and $13.5 billion in the fourth, third, second and first quarters of 2007, and $11.7 billion in the fourth quarter of 2006, respectively.
(4) Includes foreign consumer loans of $3.6 billion, $3.8 billion, $3.9 billion and $3.9 billion in the fourth, third, second and first quarters of 2007, and $3.8 billion in the fourth quarter of 2006, respectively.
(5) Includes consumer finance loans of $3.1 billion, $3.2 billion, $3.4 billion and $3.0 billion in the fourth, third, second and first quarters of 2007, and $2.8 billion in the fourth quarter of 2006, respectively; and other foreign
consumer loans of $845 million, $843 million, $775 million and $1.9 billion in the fourth, third, second and first quarters of 2007, and $4.0 billion in the fourth quarter of 2006, respectively.
(6) Includes domestic commercial real estate loans of $58.5 billion, $38.0 billion, $36.2 billion and $35.5 billion in the fourth, third, second and first quarters of 2007, and $36.1 billion in the fourth quarter of 2006,
respectively.
(7) Interest income includes the impact of interest rate risk management contracts, which decreased interest income on assets $134 million, $170 million, $117 million and $121 million in the fourth, third, second and first
quarters of 2007, and $198 million in the fourth quarter of 2006, respectively. Interest expense includes the impact of interest rate risk management contracts, which increased (decreased) interest expense on liabilities
$201 million, $226 million, $207 million and $179 million in the fourth, third, second and first quarters of 2007, and $(69) million in the fourth quarter of 2006, respectively. For further information on interest rate contracts,
see Interest Rate Risk Management for Nontrading Activities beginning on page 90.
108
Bank of America 2007