Bank of America 2007 Annual Report Download - page 82
Download and view the complete annual report
Please find page 82 of the 2007 Bank of America annual report below. You can navigate through the pages in the report by either clicking on the pages listed below, or by using the keyword search tool below to find specific information within the annual report.-
 1
1 -
2
-
3
-
4
-
5
-
6
-
7
-
8
-
9
-
10
-
11
-
12
-
13
-
14
-
15
-
16
-
17
-
18
-
19
-
20
-
21
-
22
-
23
-
24
-
25
-
26
-
27
-
28
-
29
-
30
-
31
-
32
-
33
-
34
-
35
-
36
-
37
-
38
-
39
-
40
-
41
-
42
-
43
-
44
-
45
-
46
-
47
-
48
-
49
-
50
-
51
-
52
-
53
-
54
-
55
-
56
-
57
-
58
-
59
-
60
-
61
-
62
-
63
-
64
-
65
-
66
-
67
-
68
-
69
-
70
-
71
-
 72
72 -
 73
73 -
 74
74 -
 75
75 -
 76
76 -
 77
77 -
 78
78 -
 79
79 -
 80
80 -
 81
81 -
 82
82 -
 83
83 -
 84
84 -
 85
85 -
 86
86 -
 87
87 -
 88
88 -
 89
89 -
 90
90 -
 91
91 -
 92
92 -
93
-
94
-
95
-
96
-
97
-
98
-
99
-
100
-
101
-
102
-
103
-
104
-
105
-
106
-
107
-
108
-
109
-
110
-
111
-
112
-
113
-
114
-
115
-
116
-
117
-
118
-
119
-
120
-
121
-
122
-
123
-
124
-
125
-
126
-
127
-
128
-
129
-
130
-
131
-
132
-
133
-
134
-
135
-
136
-
137
-
138
-
139
-
140
-
141
-
142
-
143
-
144
-
145
-
146
-
147
-
148
-
149
-
150
-
151
-
152
-
153
-
154
-
155
-
156
-
157
-
158
-
159
-
160
-
161
-
162
-
163
-
164
-
165
-
166
-
167
-
168
-
169
-
170
-
171
-
172
-
173
-
174
-
175
-
176
-
177
-
178
-
179
 |
 |

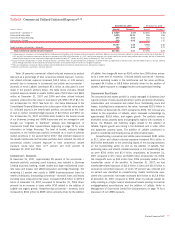
securities. In the case of default we first look to the underlying securities
and then to recovery on the purchased insurance. See page 53 for dis-
cussion on credit protection purchased on our CDO exposure.
We also have indirect exposure as we invest in securities where the
issuers have purchased wraps (i.e., insurance). For example, municipal-
ities and corporations purchase protection in order to enhance their pricing
power which has the effect of reducing their cost of borrowings. If the rat-
ing agencies downgrade the monolines, the credit rating of the bond may
fall and may have an adverse impact on the market value of the security.
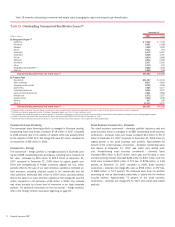
We have further exposure related to our public finance business
where we are the lead manager or remarketing agent for transactions that
are wrapped including auction rate securities (ARS), tender option munici-
pal bonds (TOBs), and variable rate demand bonds (VRDBs). We are the
lead manager on municipal and, to a lesser extent, student loan ARS
where a high percentage of the programs are wrapped by either monolines
or other financial guarantors. However, we are only the remarketing agent
on TOBs and VRDBs transactions. Recent concerns about monoline down-
grades or insolvency has caused disruptions in each of these markets as
investor concerns have impacted overall market liquidity and bond prices.
We continue to have liquidity exposure to these markets and instruments,
and as market conditions continue to evolve, these conditions may impact
our results. For information on our liquidity exposure to our public finance
business, see the municipal bond trusts and corporate SPEs discussion
beginning on page 62.
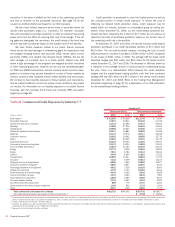
Credit protection is purchased to cover the funded portion as well as
the unfunded portion of certain credit exposure. To lessen the cost of
obtaining our desired credit protection levels, credit exposure may be
added within an industry, borrower or counterparty group by selling pro-
tection. Since December 31, 2006, our net credit default protection pur-
chased has been reduced by $1.1 billion to $7.1 billion as we continue to
reposition the level of purchased protection based on our current view of
the underlying credit risk in the portfolio.
At December 31, 2007 and 2006, we had net notional credit default
protection purchased in our credit derivatives portfolio of $7.1 billion and
$8.3 billion. The net mark-to-market impacts, including the cost of credit
default protection, resulted in net gains of $160 million in 2007 compared
to net losses of $241 million in 2006. The average VAR for these credit
derivative hedges was $22 million and $54 million for the twelve months
ended December 31, 2007 and 2006. The decrease in VAR was driven by
a reduction in the average amount of credit protection outstanding during
the year. There is a diversification effect between the credit derivative
hedges and the market-based trading portfolio such that their combined
average VAR was $55 million and $57 million for the twelve months ended
December 31, 2007 and 2006. Refer to the Trading Risk Management
discussion beginning on page 87 for a description of our VAR calculation
for the market-based trading portfolio.
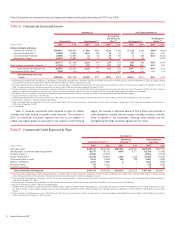
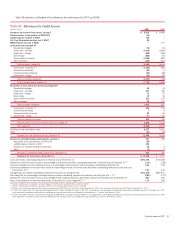
Table 21 Commercial Credit Exposure by Industry (1, 2)
December 31
Commercial Utilized Total Commercial Committed
(Dollars in millions) 2007 2006 2007 2006
Real estate
(3)
$ 81,260
$ 49,259
$111,742
$ 73,544
Diversified financials
37,872
24,813
86,118
67,038
Government and public education
31,743
22,495
57,437
39,254
Retailing
33,280
27,226
55,184
44,064
Capital goods
25,908
16,830
52,356
37,363
Healthcare equipment and services
24,337
15,881
40,962
31,189
Materials
22,176
15,978
38,717
28,789
Consumer services
23,382
19,191
38,650
32,734
Banks
21,261
26,405
35,323
36,735
Individuals and trusts
22,323
18,792
32,425
29,167
Commercial services and supplies
21,175
15,224
31,858
23,532
Food, beverage and tobacco
13,919
11,384
25,701
21,124
Energy
12,772
9,505
23,510
18,460
Media
7,901
8,784
19,343
19,181
Utilities
6,438
6,624
19,281
17,222
Transportation
12,803
11,637
18,824
17,375
Insurance
7,162
6,759
16,014
14,122
Religious and social organizations
8,208
7,840
10,982
10,507
Consumer durables and apparel
5,802
4,827
10,907
9,124
Technology hardware and equipment
4,615
3,326
10,239
8,093
Software and services
4,739
2,763
10,128
6,212
Pharmaceuticals and biotechnology
4,349
2,530
8,563
6,289
Telecommunication services
3,475
3,565
8,235
7,981
Automobiles and components
2,648
1,584
6,960
5,153
Food and staples retailing
2,732
2,153
5,318
4,222
Household and personal products
889
779
2,776
2,264
Semiconductors and semiconductor equipment
1,140
802
1,734
1,364
Other
8,407
7,346
8,505
7,775
Total commercial credit exposure by industry
$452,716
$344,302
$787,792
$619,877
Net credit default protection purchased on total commitments
(4)
$ (7,146)
$ (8,260)
(1) Total commercial utilized and total commercial committed exposure includes loans and letters of credit measured at fair value in accordance with SFAS 159 and are comprised of loans outstanding of $4.59 billion and issued
letters of credit at notional value of $1.1 billion at December 31, 2007. In addition, total commercial committed exposure includes unfunded loan commitments at notional value of $19.8 billion at December 31, 2007.
(2) Includes small business commercial – domestic exposure.
(3) Industries are viewed from a variety of perspectives to best isolate the perceived risks. For purposes of this table, the real estate industry is defined based upon the borrowers’ or counterparties’ primary business activity using
operating cash flow and primary source of repayment as key factors.
(4) Represents net notional credit protection purchased.
80
Bank of America 2007