Bank of America 2007 Annual Report Download - page 139
Download and view the complete annual report
Please find page 139 of the 2007 Bank of America annual report below. You can navigate through the pages in the report by either clicking on the pages listed below, or by using the keyword search tool below to find specific information within the annual report.-
 1
1 -
2
-
3
-
4
-
5
-
6
-
7
-
8
-
9
-
10
-
11
-
12
-
13
-
14
-
15
-
16
-
17
-
18
-
19
-
20
-
21
-
22
-
23
-
24
-
25
-
26
-
27
-
28
-
29
-
30
-
31
-
32
-
33
-
34
-
35
-
36
-
37
-
38
-
39
-
40
-
41
-
42
-
43
-
44
-
45
-
46
-
47
-
48
-
49
-
50
-
51
-
52
-
53
-
54
-
55
-
56
-
57
-
58
-
59
-
60
-
61
-
62
-
63
-
64
-
65
-
66
-
67
-
68
-
69
-
70
-
71
-
72
-
73
-
74
-
75
-
76
-
77
-
78
-
79
-
80
-
81
-
82
-
83
-
84
-
85
-
86
-
87
-
88
-
89
-
90
-
91
-
92
-
93
-
94
-
95
-
96
-
97
-
98
-
99
-
100
-
101
-
102
-
103
-
104
-
105
-
106
-
107
-
108
-
109
-
110
-
111
-
112
-
113
-
114
-
115
-
116
-
117
-
118
-
119
-
120
-
121
-
122
-
123
-
124
-
125
-
126
-
127
-
128
-
 129
129 -
 130
130 -
 131
131 -
 132
132 -
 133
133 -
 134
134 -
 135
135 -
 136
136 -
 137
137 -
 138
138 -
 139
139 -
 140
140 -
 141
141 -
 142
142 -
 143
143 -
 144
144 -
 145
145 -
 146
146 -
 147
147 -
 148
148 -
 149
149 -
150
-
151
-
152
-
153
-
154
-
155
-
156
-
157
-
158
-
159
-
160
-
161
-
162
-
163
-
164
-
165
-
166
-
167
-
168
-
169
-
170
-
171
-
172
-
173
-
174
-
175
-
176
-
177
-
178
-
179
 |
 |

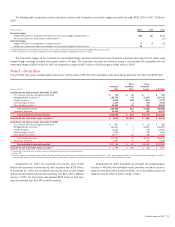
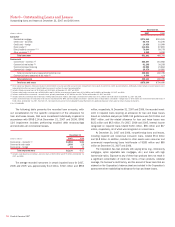
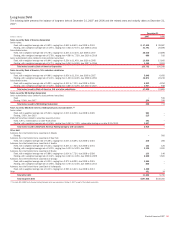
Portfolio balances, delinquency and historical loss amounts of the managed loans and leases portfolio for 2007 and 2006 were as follows:
December 31, 2007 December 31, 2006
(Dollars in millions)
Total Loans
and Leases
Accruing
Loans and
Leases Past
Due 90 Days
or More
Nonperforming
Loans and Leases
Total Loans
and Leases
Accruing
Loans and
Leases Past
Due 90 Days
or More
Nonperforming
Loans and Leases
Residential mortgage
(1)
$ 278,733 $ 237 $1,999
$ 245,840 $ 118 $ 660
Credit card – domestic
151,862 4,170 n/a
142,599 3,828 n/a
Credit card – foreign
31,829 714 n/a
27,890 608 n/a
Home equity
115,009 – 1,342
88,202 – 293
Direct/Indirect consumer
78,564 752 8
66,266 524 2
Other consumer
3,850 4 95
5,059 7 77
Total consumer
659,847 5,877 3,444
575,856 5,085 1,032
Commercial – domestic
(2, 3)
209,087 546 1,004
163,274 265 598
Commercial real estate
61,298 36 1,099
36,258 78 118
Commercial lease financing
22,582 25 33
21,864 26 42
Commercial – foreign
28,376 16 19
20,681 9 13
Total commercial
321,343 623 2,155
242,077 378 771
Total managed loans and leases
measured at historical cost
981,190 6,500 5,599
817,933 5,463 1,803
Total measured at fair value
4,590 – –
n/a n/a n/a
Managed loans in securitizations
(109,436) (2,764) (2)
(111,443) (2,407) (16)
Total held loans and leases
$ 876,344 $ 3,736 $5,597
$ 706,490 $ 3,056 $1,787
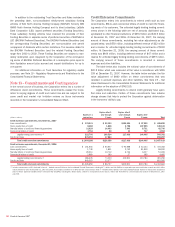
Year Ended December 31, 2007 Year Ended December 31, 2006
(Dollars in millions)
Average
Loans and
Leases
Outstanding
Net
Losses
Net Loss
Ratio
(4)
Average
Loans and
Leases
Outstanding
Net
Losses
Net Loss
Ratio
(4)
Residential mortgage
$ 268,879 $ 57 0.02%
$ 213,097 $ 39 0.02%
Credit card – domestic
141,795 6,960 4.91
138,592 5,395 3.89
Credit card – foreign
29,581 1,254 4.24
24,817 980 3.95
Home equity
99,023 274 0.28
78,692 51 0.07
Direct/Indirect consumer
74,829 1,603 2.14
62,002 925 1.49
Other consumer
4,259 278 6.54
7,317 217 2.97
Total consumer
618,366 10,426 1.69
524,517 7,607 1.45
Commercial – domestic
(2, 5)
178,932 1,007 0.56
153,796 367 0.24
Commercial real estate
42,783 47 0.11
36,939 3 0.01
Commercial lease financing
20,435 2 0.01
20,862 (28) (0.14)
Commercial – foreign
23,931 1 –
23,521 (8) (0.04)
Total commercial
266,081 1,057 0.40
235,118 334 0.14
Total managed loans and leases
measured at historical cost
884,447 11,483 1.30
759,635 7,941 1.05
Total measured at fair value
3,012 n/a n/a
n/a n/a n/a
Managed loans in securitizations
(111,305) (5,003) 4.50
(107,218) (3,402) 3.17
Total held loans and leases
$ 776,154 $ 6,480 0.84
$ 652,417 $ 4,539 0.70
(1) Accruing loans and leases past due 90 days or more represent residential mortgage loans related to repurchases pursuant to the Corporation’s servicing agreements with GNMA mortgage pools, where repayments are insured
by the Federal Housing Administration or guaranteed by the Department of Veterans Affairs.
(2) Includes small business commercial – domestic loans.
(3) Includes small business – commercial domestic accruing loans and leases past due 90 days or more of $427 million and $199 million and nonperforming loans and leases of $135 million and $79 million at December 31,
2007 and 2006.
(4) The net loss ratios are calculated as managed net losses divided by average outstanding managed loans and leases measured at historical cost for each loan and lease category.
(5) Includes small business – commercial domestic net losses of $869 million, or 5.57 percent, and $361 million, or 3.00 percent, in 2007 and 2006.
n/a = not applicable
Bank of America 2007
137