Bank of America 2007 Annual Report Download - page 172
Download and view the complete annual report
Please find page 172 of the 2007 Bank of America annual report below. You can navigate through the pages in the report by either clicking on the pages listed below, or by using the keyword search tool below to find specific information within the annual report.-
 1
1 -
2
-
3
-
4
-
5
-
6
-
7
-
8
-
9
-
10
-
11
-
12
-
13
-
14
-
15
-
16
-
17
-
18
-
19
-
20
-
21
-
22
-
23
-
24
-
25
-
26
-
27
-
28
-
29
-
30
-
31
-
32
-
33
-
34
-
35
-
36
-
37
-
38
-
39
-
40
-
41
-
42
-
43
-
44
-
45
-
46
-
47
-
48
-
49
-
50
-
51
-
52
-
53
-
54
-
55
-
56
-
57
-
58
-
59
-
60
-
61
-
62
-
63
-
64
-
65
-
66
-
67
-
68
-
69
-
70
-
71
-
72
-
73
-
74
-
75
-
76
-
77
-
78
-
79
-
80
-
81
-
82
-
83
-
84
-
85
-
86
-
87
-
88
-
89
-
90
-
91
-
92
-
93
-
94
-
95
-
96
-
97
-
98
-
99
-
100
-
101
-
102
-
103
-
104
-
105
-
106
-
107
-
108
-
109
-
110
-
111
-
112
-
113
-
114
-
115
-
116
-
117
-
118
-
119
-
120
-
121
-
122
-
123
-
124
-
125
-
126
-
127
-
128
-
129
-
130
-
131
-
132
-
133
-
134
-
135
-
136
-
137
-
138
-
139
-
140
-
141
-
142
-
143
-
144
-
145
-
146
-
147
-
148
-
149
-
150
-
151
-
152
-
153
-
154
-
155
-
156
-
157
-
158
-
159
-
160
-
161
-
 162
162 -
 163
163 -
 164
164 -
 165
165 -
 166
166 -
 167
167 -
 168
168 -
 169
169 -
 170
170 -
 171
171 -
 172
172 -
 173
173 -
 174
174 -
 175
175 -
 176
176 -
 177
177 -
 178
178 -
 179
179
 |
 |

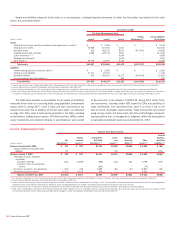
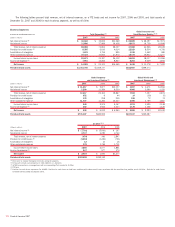
The following tables present total revenue, net of interest expense, on a FTE basis and net income for 2007, 2006 and 2005, and total assets at
December 31, 2007 and 2006 for each business segment, as well as All Other.
Business Segments
At and for the Year Ended December 31 Total Corporation
(1)
Global Consumer and
Small Business Banking
(2, 3)
(Dollars in millions) 2007 2006 2005 2007 2006 2005
Net interest income
(4)
$ 36,182
$ 35,815 $31,569
$ 28,809
$ 28,197 $17,571
Noninterest income
31,886
37,989 26,438
18,873
16,729 10,848
Total revenue, net of interest expense
68,068
73,804 58,007
47,682
44,926 28,419
Provision for credit losses
(5)
8,385
5,010 4,014
12,929
8,534 4,706
Amortization of intangibles
1,676
1,755 809
1,336
1,452 480
Other noninterest expense
35,334
33,842 27,872
18,724
16,923 12,277
Income before income taxes
22,673
33,197 25,312
14,693
18,017 10,956
Income tax expense
(4)
7,691
12,064 8,847
5,263
6,639 3,934
Net income
$ 14,982
$ 21,133 $16,465
$ 9,430
$ 11,378 $ 7,022
Period-end total assets
$1,715,746
$1,459,737
$442,987
$399,373
Global Corporate
and Investment Banking
(2)
Global Wealth and
Investment Management
(2)
(Dollars in millions) 2007 2006 2005 2007 2006 2005
Net interest income
(4)
$ 11,217
$ 9,877 $10,337
$ 3,857
$ 3,671 $3,554
Noninterest income
2,200
11,284 9,530
4,066
3,686 3,320
Total revenue, net of interest expense
13,417
21,161 19,867
7,923
7,357 6,874
Provision for credit losses
652
944
14
(39) (5)
Amortization of intangibles
178
218 239
150
72 74
Other noninterest expense
11,747
11,360 10,217
4,485
3,795 3,667
Income before income taxes
840
9,574 9,367
3,274
3,529 3,138
Income tax expense
(4)
302
3,542 3,413
1,179
1,306 1,126
Net income
$ 538
$ 6,032 $ 5,954
$ 2,095
$ 2,223 $2,012
Period-end total assets
$776,107
$685,935
$157,157
$125,287
All Other
(2, 3)
(Dollars in millions) 2007 2006 2005
Net interest income
(4)
$ (7,701)
$ (5,930) $ 107
Noninterest income
6,747
6,290 2,740
Total revenue, net of interest expense
(954)
360 2,847
Provision for credit losses
(5)
(5,210)
(3,494) (731)
Amortization of intangibles
12
13 16
Other noninterest expense
378
1,764 1,711
Income before income taxes
3,866
2,077 1,851
Income tax expense
(4)
947
577 374
Net income
$ 2,919
$ 1,500 $1,477
Period-end total assets
$339,495
$249,142
(1) There were no material intersegment revenues among the segments.
(2) Total assets include asset allocations to match liabilities (i.e., deposits).
(3) GCSBB is presented on a managed basis with a corresponding offset recorded in All Other.
(4) FTE basis
(5) Provision for credit losses represents: For GCSBB – Provision for credit losses on held loans combined with realized credit losses associated with the securitized loan portfolio and for All Other – Provision for credit losses
combined with the GCSBB securitization offset.
170
Bank of America 2007