Bank of America 2007 Annual Report Download - page 111
Download and view the complete annual report
Please find page 111 of the 2007 Bank of America annual report below. You can navigate through the pages in the report by either clicking on the pages listed below, or by using the keyword search tool below to find specific information within the annual report.-
 1
1 -
2
-
3
-
4
-
5
-
6
-
7
-
8
-
9
-
10
-
11
-
12
-
13
-
14
-
15
-
16
-
17
-
18
-
19
-
20
-
21
-
22
-
23
-
24
-
25
-
26
-
27
-
28
-
29
-
30
-
31
-
32
-
33
-
34
-
35
-
36
-
37
-
38
-
39
-
40
-
41
-
42
-
43
-
44
-
45
-
46
-
47
-
48
-
49
-
50
-
51
-
52
-
53
-
54
-
55
-
56
-
57
-
58
-
59
-
60
-
61
-
62
-
63
-
64
-
65
-
66
-
67
-
68
-
69
-
70
-
71
-
72
-
73
-
74
-
75
-
76
-
77
-
78
-
79
-
80
-
81
-
82
-
83
-
84
-
85
-
86
-
87
-
88
-
89
-
90
-
91
-
92
-
93
-
94
-
95
-
96
-
97
-
98
-
99
-
100
-
 101
101 -
 102
102 -
 103
103 -
 104
104 -
 105
105 -
 106
106 -
 107
107 -
 108
108 -
 109
109 -
 110
110 -
 111
111 -
 112
112 -
 113
113 -
 114
114 -
 115
115 -
 116
116 -
 117
117 -
 118
118 -
 119
119 -
 120
120 -
 121
121 -
122
-
123
-
124
-
125
-
126
-
127
-
128
-
129
-
130
-
131
-
132
-
133
-
134
-
135
-
136
-
137
-
138
-
139
-
140
-
141
-
142
-
143
-
144
-
145
-
146
-
147
-
148
-
149
-
150
-
151
-
152
-
153
-
154
-
155
-
156
-
157
-
158
-
159
-
160
-
161
-
162
-
163
-
164
-
165
-
166
-
167
-
168
-
169
-
170
-
171
-
172
-
173
-
174
-
175
-
176
-
177
-
178
-
179
 |
 |

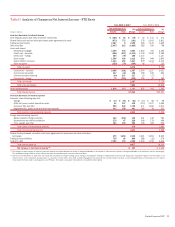
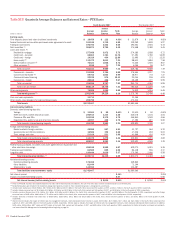
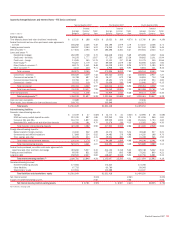
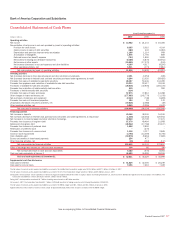
Quarterly Average Balances and Interest Rates – FTE Basis (continued)
Second Quarter 2007 First Quarter 2007 Fourth Quarter 2006
(Dollars in millions)
Average
Balance
Interest
Income/
Expense
Yield/
Rate
Average
Balance
Interest
Income/
Expense
Yield/
Rate
Average
Balance
Interest
Income/
Expense
Yield/
Rate
Earning assets
Time deposits placed and other short-term investments $ 15,310 $ 188 4.92% $ 15,023 $ 169 4.57% $ 15,760 $ 166 4.19%
Federal funds sold and securities purchased under agreements
to resell 166,258 2,156 5.19 166,195 1,979 4.79 174,167 2,068 4.73
Trading account assets 188,287 2,364 5.03 175,249 2,357 5.41 167,163 2,289 5.46
Debt securities
(1)
177,834 2,394 5.39 186,498 2,451 5.27 193,601 2,504 5.17
Loans and leases
(2)
:
Residential mortgage 260,099 3,708 5.70 246,618 3,504 5.69 225,985 3,202 5.66
Credit card – domestic 56,235 1,777 12.67 57,720 1,887 13.26 59,802 2,101 13.94
Credit card – foreign 11,946 350 11.76 11,133 317 11.55 10,375 305 11.66
Home equity
(3)
94,267 1,779 7.57 89,559 1,679 7.60 84,905 1,626 7.60
Direct/Indirect consumer
(4)
68,175 1,441 8.48 64,038 1,303 8.25 57,273 1,185 8.21
Other consumer
(5)
4,153 100 9.71 4,928 122 9.93 6,804 141 8.32
Total consumer 494,875 9,155 7.41 473,996 8,812 7.50 445,144 8,560 7.65
Commercial – domestic 166,529 3,039 7.32 163,620 2,934 7.27 158,604 2,907 7.27
Commercial real estate
(6)
36,788 687 7.49 36,117 672 7.55 36,851 704 7.58
Commercial lease financing 19,784 217 4.40 19,651 175 3.55 21,159 254 4.80
Commercial – foreign 22,223 319 5.75 20,658 330 6.48 21,840 337 6.12
Total commercial 245,324 4,262 6.97 240,046 4,111 6.94 238,454 4,202 7.00
Total loans and leases 740,199 13,417 7.26 714,042 12,923 7.31 683,598 12,762 7.42
Other earning assets 70,311 1,108 6.31 64,939 1,010 6.28 65,172 1,058 6.46
Total earning assets (7) 1,358,199 21,627 6.38 1,321,946 20,889 6.37 1,299,461 20,847 6.39
Cash and cash equivalents 33,689 33,623 32,816
Other assets, less allowance for loan and lease losses 169,761 165,849 162,873
Total assets $1,561,649 $1,521,418 $1,495,150
Interest-bearing liabilities
Domestic interest-bearing deposits:
Savings $ 33,039 $ 47 0.58% $ 32,773 $ 41 0.50% $ 32,965 $ 48 0.58%
NOW and money market deposit accounts 212,330 987 1.86 212,249 936 1.79 211,055 966 1.81
Consumer CDs and IRAs 161,703 1,857 4.61 159,505 1,832 4.66 154,621 1,794 4.60
Negotiable CDs, public funds and other time deposits 16,256 191 4.70 13,376 136 4.12 13,052 140 4.30
Total domestic interest-bearing deposits 423,328 3,082 2.92 417,903 2,945 2.86 411,693 2,948 2.84
Foreign interest-bearing deposits:
Banks located in foreign countries 41,940 522 4.99 40,372 531 5.34 38,648 507 5.21
Governments and official institutions 17,868 224 5.02 14,482 178 4.98 14,220 168 4.70
Time, savings and other 40,335 433 4.31 39,534 380 3.90 41,328 366 3.50
Total foreign interest-bearing deposits 100,143 1,179 4.72 94,388 1,089 4.68 94,196 1,041 4.38
Total interest-bearing deposits 523,471 4,261 3.27 512,291 4,034 3.19 505,889 3,989 3.13
Federal funds purchased, securities sold under agreements to
repurchase and other short-term borrowings 419,260 5,537 5.30 414,104 5,318 5.20 405,748 5,222 5.11
Trading account liabilities 85,550 821 3.85 77,635 892 4.66 75,261 800 4.21
Long-term debt 158,500 2,227 5.62 148,627 2,048 5.51 140,756 1,881 5.34
Total interest-bearing liabilities (7) 1,186,781 12,846 4.34 1,152,657 12,292 4.31 1,127,654 11,892 4.19
Noninterest-bearing sources:
Noninterest-bearing deposits 173,564 174,413 174,356
Other liabilities 67,753 60,760 59,093
Shareholders’ equity 133,551 133,588 134,047
Total liabilities and shareholders’ equity $1,561,649 $1,521,418 $1,495,150
Net interest spread 2.04% 2.06% 2.20%
Impact of noninterest-bearing sources 0.55 0.55 0.55
Net interest income/yield on earning assets $ 8,781 2.59% $ 8,597 2.61% $8,955 2.75%
For Footnotes, see page 108.
Bank of America 2007
109