Bank of America 2007 Annual Report Download - page 46
Download and view the complete annual report
Please find page 46 of the 2007 Bank of America annual report below. You can navigate through the pages in the report by either clicking on the pages listed below, or by using the keyword search tool below to find specific information within the annual report.-
 1
1 -
2
-
3
-
4
-
5
-
6
-
7
-
8
-
9
-
10
-
11
-
12
-
13
-
14
-
15
-
16
-
17
-
18
-
19
-
20
-
21
-
22
-
23
-
24
-
25
-
26
-
27
-
28
-
29
-
30
-
31
-
32
-
33
-
34
-
35
-
 36
36 -
 37
37 -
 38
38 -
 39
39 -
 40
40 -
 41
41 -
 42
42 -
 43
43 -
 44
44 -
 45
45 -
 46
46 -
 47
47 -
 48
48 -
 49
49 -
 50
50 -
 51
51 -
 52
52 -
 53
53 -
 54
54 -
 55
55 -
 56
56 -
57
-
58
-
59
-
60
-
61
-
62
-
63
-
64
-
65
-
66
-
67
-
68
-
69
-
70
-
71
-
72
-
73
-
74
-
75
-
76
-
77
-
78
-
79
-
80
-
81
-
82
-
83
-
84
-
85
-
86
-
87
-
88
-
89
-
90
-
91
-
92
-
93
-
94
-
95
-
96
-
97
-
98
-
99
-
100
-
101
-
102
-
103
-
104
-
105
-
106
-
107
-
108
-
109
-
110
-
111
-
112
-
113
-
114
-
115
-
116
-
117
-
118
-
119
-
120
-
121
-
122
-
123
-
124
-
125
-
126
-
127
-
128
-
129
-
130
-
131
-
132
-
133
-
134
-
135
-
136
-
137
-
138
-
139
-
140
-
141
-
142
-
143
-
144
-
145
-
146
-
147
-
148
-
149
-
150
-
151
-
152
-
153
-
154
-
155
-
156
-
157
-
158
-
159
-
160
-
161
-
162
-
163
-
164
-
165
-
166
-
167
-
168
-
169
-
170
-
171
-
172
-
173
-
174
-
175
-
176
-
177
-
178
-
179
 |
 |

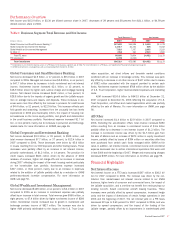
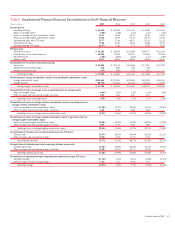
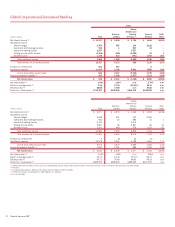
Table 7 Core Net Interest Income – Managed Basis
(Dollars in millions) 2007 2006 2005
Net interest income
(1)
As reported $ 36,182 $ 35,815 $ 31,569
Impact of market-based net interest income
(2)
(2,716) (1,660) (1,975)
Core net interest income 33,466 34,155 29,594
Impact of securitizations
(3)
7,841 7,045 323
Core net interest income – managed basis $ 41,307 $ 41,200 $ 29,917
Average earning assets
As reported $1,390,192 $1,269,144 $1,111,994
Impact of market-based earning assets
(2)
(412,326) (370,187) (323,361)
Core average earning assets 977,866 898,957 788,633
Impact of securitizations 103,371 98,152 9,033
Core average earning assets – managed basis $1,081,237 $ 997,109 $ 797,666
Net interest yield contribution
(1)
As reported 2.60% 2.82% 2.84%
Impact of market-based activities
(2)
0.82 0.98 0.91
Core net interest yield on earning assets 3.42 3.80 3.75
Impact of securitizations 0.40 0.33 –
Core net interest yield on earning assets – managed basis 3.82% 4.13% 3.75%
(1) FTE basis
(2) Represents the impact of market-based amounts included in the CMAS business within GCIB and excludes $70 million of net interest income on loans for which the fair value option has been elected.
(3) Represents the impact of securitizations utilizing actual bond costs. This is different from the business segment view which utilizes funds transfer pricing methodologies.
Core Net Interest Income – Managed Basis
We manage core net interest income – managed basis, which adjusts
reported net interest income on a FTE basis for the impact of market-
based activities and certain securitizations, net of retained securities. As
discussed in the GCIB business segment section beginning on page 50,
we evaluate our market-based results and strategies on a total market-
based revenue approach by combining net interest income and noninterest
income for CMAS. We also adjust for loans that we originated and sub-
sequently sold into certain securitizations. These securitizations include
off-balance sheet loans and leases, primarily credit card securitizations
where servicing is retained by the Corporation, but excludes first mortgage
securitizations. Noninterest income, rather than net interest income and
provision for credit losses, is recorded for assets that have been securi-
tized as we are compensated for servicing the securitized assets and
record servicing income and gains or losses on securitizations, where
appropriate. We believe the use of this non-GAAP presentation provides
additional clarity in managing our results. An analysis of core net interest
income – managed basis, core average earning assets – managed basis
and core net interest yield on earning assets – managed basis, which
adjusts for the impact of these two non-core items from reported net inter-
est income on a FTE basis, is shown in the table above.
Core net interest income on a managed basis increased $107 million
in 2007 compared to 2006. The increase was driven by higher levels of
consumer and commercial loans, the impact of the LaSalle acquisition,
and a one-time tax benefit from restructuring our existing non-U.S. based
commercial aircraft leasing business. These increases were partially offset
by spread compression, increased hedge costs and the impact of divest-
itures of certain foreign operations in late 2006 and the beginning of
2007.
On a managed basis, core average earning assets increased $84.1
billion in 2007 compared to 2006 due to higher levels of consumer and
commercial managed loans and increased levels from ALM activities parti-
ally offset by a decrease in average balances from the divestitures men-
tioned above.
Core net interest yield on a managed basis decreased 31 bps to
3.82 percent compared to 2006 and was driven by spread compression,
higher costs of deposits, the impact of the funding of the LaSalle merger
and the sale of certain foreign operations.
Business Segment Operations
Segment Description
We report the results of our operations through three business segments:
GCSBB, GCIB and GWIM, with the remaining operations recorded in All
Other. Certain prior period amounts have been reclassified to conform to
current period presentation. For more information on our basis of pre-
sentation, selected financial information for the business segments and
reconciliations to consolidated total revenue, net income and period end
total asset amounts, see Note 22 – Business Segment Information to the
Consolidated Financial Statements.
Basis of Presentation
We prepare and evaluate segment results using certain non-GAAP method-
ologies and performance measures, many of which are discussed in Sup-
plemental Financial Data beginning on page 42. We begin by evaluating
the operating results of the businesses which by definition excludes
merger and restructuring charges. The segment results also reflect certain
revenue and expense methodologies which are utilized to determine net
income. The net interest income of the businesses includes the results of
a funds transfer pricing process that matches assets and liabilities with
similar interest rate sensitivity and maturity characteristics.
The management accounting reporting process derives segment and
business results by utilizing allocation methodologies for revenue,
expense and capital. The net income derived for the businesses is
dependent upon revenue and cost allocations using an activity-based cost-
ing model, funds transfer pricing, and other methodologies and assump-
tions management believes are appropriate to reflect the results of the
business.
44
Bank of America 2007