Bank of America 2007 Annual Report Download - page 77
Download and view the complete annual report
Please find page 77 of the 2007 Bank of America annual report below. You can navigate through the pages in the report by either clicking on the pages listed below, or by using the keyword search tool below to find specific information within the annual report.-
 1
1 -
2
-
3
-
4
-
5
-
6
-
7
-
8
-
9
-
10
-
11
-
12
-
13
-
14
-
15
-
16
-
17
-
18
-
19
-
20
-
21
-
22
-
23
-
24
-
25
-
26
-
27
-
28
-
29
-
30
-
31
-
32
-
33
-
34
-
35
-
36
-
37
-
38
-
39
-
40
-
41
-
42
-
43
-
44
-
45
-
46
-
47
-
48
-
49
-
50
-
51
-
52
-
53
-
54
-
55
-
56
-
57
-
58
-
59
-
60
-
61
-
62
-
63
-
64
-
65
-
66
-
 67
67 -
 68
68 -
 69
69 -
 70
70 -
 71
71 -
 72
72 -
 73
73 -
 74
74 -
 75
75 -
 76
76 -
 77
77 -
 78
78 -
 79
79 -
 80
80 -
 81
81 -
 82
82 -
 83
83 -
 84
84 -
 85
85 -
 86
86 -
 87
87 -
88
-
89
-
90
-
91
-
92
-
93
-
94
-
95
-
96
-
97
-
98
-
99
-
100
-
101
-
102
-
103
-
104
-
105
-
106
-
107
-
108
-
109
-
110
-
111
-
112
-
113
-
114
-
115
-
116
-
117
-
118
-
119
-
120
-
121
-
122
-
123
-
124
-
125
-
126
-
127
-
128
-
129
-
130
-
131
-
132
-
133
-
134
-
135
-
136
-
137
-
138
-
139
-
140
-
141
-
142
-
143
-
144
-
145
-
146
-
147
-
148
-
149
-
150
-
151
-
152
-
153
-
154
-
155
-
156
-
157
-
158
-
159
-
160
-
161
-
162
-
163
-
164
-
165
-
166
-
167
-
168
-
169
-
170
-
171
-
172
-
173
-
174
-
175
-
176
-
177
-
178
-
179
 |
 |
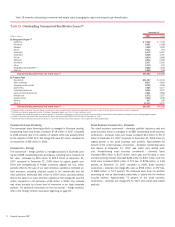
From the perspective of portfolio risk management, customer concen-
tration management is most relevant in GCIB. Within that segment’s Busi-
ness Lending and CMAS businesses, we facilitate bridge financing (high
grade debt, high yield debt, CMBS and equity) to fund acquisitions, recapi-
talizations and other short-term needs as well as provide syndicated
financing for our clients. These concentrations are managed in part
through our established “originate to distribute” strategy. These client
transactions are sometimes large and leveraged. They can also have a
higher degree of risk as we are providing offers or commitments for vari-
ous components of the clients’ capital structures, including lower rated
unsecured and subordinated debt tranches and/or equity. In many cases,
these offers to finance will not be accepted. If accepted, these conditional
commitments are often retired prior to or shortly following funding via the
placement of securities, syndication or the client’s decision to terminate.
Where we have a binding commitment and there is a market disruption or
other unexpected event, there may be heightened exposure in the portfo-
lios and forward calendar, and a higher potential for writedown or loss
unless the terms of the commitment can be modified and/or an orderly
disposition of the exposure can be made.
The Corporation’s share of the leveraged finance and CMBS forward
calendars were $12.2 billion and $2.0 billion, respectively, at
December 31, 2007. Funded leveraged finance and CMBS exposure
included in assets held-for-sale totaled $6.1 billion and $13.7 billion at
December 31, 2007. The funded CMBS exposure includes amounts
assumed with the acquisition of LaSalle. The funded CMBS debt consisted
of $6.9 billion of floating-rate acquisition related financings to major, well
known operating companies. In addition, of the CMBS forward calendar,
$1.1 billion were floating-rate acquisition related financings. Writedowns
were taken on both funded and forward calendar commitments to reflect
the current market prices, if available, or the estimated price at which the
exposures could be distributed in the market. In the first quarter of 2008
the leveraged finance markets began to experience disruptions similar to
those experienced in the second half of 2007 and it is unclear what
impact these conditions will have on our results.
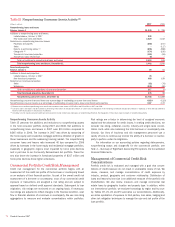
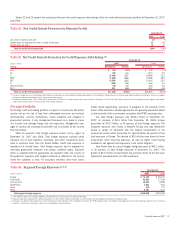
Prior to January 1, 2007, the Corporation accounted for all loans in
the held-to-maturity portfolio on a historical cost basis and incurred losses
on this portfolio were charged against the allowance for loan and lease
losses. Effective January 1, 2007, the Corporation elected to account for
certain large corporate loans and loan commitments (including issued but
unfunded letters of credit which are considered utilized for credit risk
management purposes), which exceed the Corporation’s single name
credit risk concentration guidelines at fair value in accordance with SFAS
159.
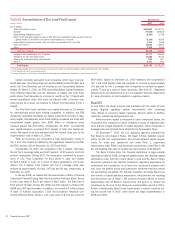
The Corporation initially adopted the fair value option for $4.0 billion
of outstanding commercial loans as of January 1, 2007 and recorded
pre-tax net losses of $21 million (net of adjustments related to the allow-
ance for loan and lease losses and direct loan origination fees and costs)
representing the excess of carrying value over fair value of the funded
loans, with the after-tax amount recorded in retained earnings. The Corpo-
ration also initially adopted the fair value option for $21.1 billion of
unfunded commercial commitments, including letters of credit, as of Jan-
uary 1, 2007, and recorded pre-tax net losses of $321 million (net of
associated adjustments related to the reserve for unfunded lending com-
mitments) representing the difference between the carrying value and the
fair value of the unfunded lending commitments, with the after-tax amount
recorded in retained earnings.
After the initial application of SFAS 159, any fair value adjustment
upon origination and subsequent changes in the fair value of loans and
unfunded commitments is recorded in other income. By including the
credit risk of the borrower in the fair value adjustments, any credit deterio-
ration or improvement is recorded immediately as part of the fair value
adjustment. As a result, the allowance for loan and lease losses and the
reserve for unfunded lending commitments are no longer used to capture
credit losses inherent in these nonperforming or impaired loans and
unfunded commitments. The remaining Commercial Credit Portfolio tables
have been modified to exclude loans and unfunded commitments that are
carried at fair value and to adjust certain ratios for this accounting change.
See Note 19 – Fair Value Disclosures to the Consolidated Financial
Statements for additional information on the adoption of SFAS 159.
At December 31, 2007, outstanding commercial loans measured at
fair value had an aggregate fair value of $4.59 billion recorded in loans
and leases and included commercial – domestic loans of $3.50 billion,
commercial – foreign loans of $790 million and commercial real estate
loans of $304 million. The Corporation recorded net losses of $139 mil-
lion in other income resulting from changes in the fair value of the loan
portfolio during 2007.
In addition, unfunded lending commitments and letters of credit had
an aggregate fair value of $660 million and were recorded in accrued
expenses and other liabilities. The December 31, 2007 aggregate notional
amount of unfunded lending commitments and letters of credit subject to
fair value treatment was $20.9 billion. Net losses resulting from changes
in fair value of commitments and letters of credit of $274 million were
recorded in other income during 2007.
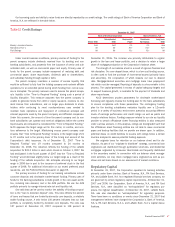
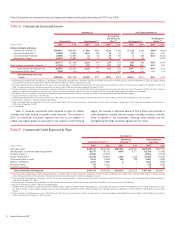
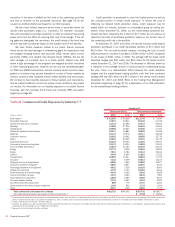
Commercial Credit Portfolio
Commercial credit quality indicators deteriorated from favorable levels
experienced in 2006, in part attributable to the weakness in the housing
and financial markets. The loans and leases net charge-off ratio increased
to 0.40 percent from 0.13 percent a year ago. The increase was princi-
pally attributable to seasoning and deterioration in our small business
portfolio in GCSBB as well as a lower level of commercial recoveries in
GCIB and GWIM. Excluding small business commercial – domestic the
total commercial net charge-off ratio was 0.08 percent compared to a net
recovery ratio of 0.03 percent in 2006, primarily due to a lower level of
recoveries in 2007. The nonperforming loan and commercial utilized criti-
cized exposure ratios were 0.67 percent and 4.17 percent at
December 31, 2007 compared to 0.31 percent and 2.20 percent at
December 31, 2006, mostly related to the addition of LaSalle and
exposure to the homebuilder and mortgage lender sectors.
Bank of America 2007
75