Bank of America 2007 Annual Report Download - page 134
Download and view the complete annual report
Please find page 134 of the 2007 Bank of America annual report below. You can navigate through the pages in the report by either clicking on the pages listed below, or by using the keyword search tool below to find specific information within the annual report.-
 1
1 -
2
-
3
-
4
-
5
-
6
-
7
-
8
-
9
-
10
-
11
-
12
-
13
-
14
-
15
-
16
-
17
-
18
-
19
-
20
-
21
-
22
-
23
-
24
-
25
-
26
-
27
-
28
-
29
-
30
-
31
-
32
-
33
-
34
-
35
-
36
-
37
-
38
-
39
-
40
-
41
-
42
-
43
-
44
-
45
-
46
-
47
-
48
-
49
-
50
-
51
-
52
-
53
-
54
-
55
-
56
-
57
-
58
-
59
-
60
-
61
-
62
-
63
-
64
-
65
-
66
-
67
-
68
-
69
-
70
-
71
-
72
-
73
-
74
-
75
-
76
-
77
-
78
-
79
-
80
-
81
-
82
-
83
-
84
-
85
-
86
-
87
-
88
-
89
-
90
-
91
-
92
-
93
-
94
-
95
-
96
-
97
-
98
-
99
-
100
-
101
-
102
-
103
-
104
-
105
-
106
-
107
-
108
-
109
-
110
-
111
-
112
-
113
-
114
-
115
-
116
-
117
-
118
-
119
-
120
-
121
-
122
-
123
-
 124
124 -
 125
125 -
 126
126 -
 127
127 -
 128
128 -
 129
129 -
 130
130 -
 131
131 -
 132
132 -
 133
133 -
 134
134 -
 135
135 -
 136
136 -
 137
137 -
 138
138 -
 139
139 -
 140
140 -
 141
141 -
 142
142 -
 143
143 -
 144
144 -
145
-
146
-
147
-
148
-
149
-
150
-
151
-
152
-
153
-
154
-
155
-
156
-
157
-
158
-
159
-
160
-
161
-
162
-
163
-
164
-
165
-
166
-
167
-
168
-
169
-
170
-
171
-
172
-
173
-
174
-
175
-
176
-
177
-
178
-
179
 |
 |

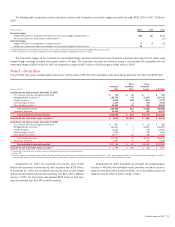
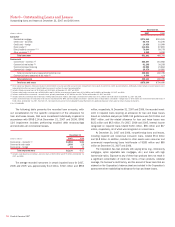
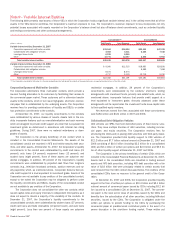
The following table presents the current fair value and the associated gross unrealized losses only on investments in securities with gross unrealized
losses at December 31, 2007 and 2006. The table also discloses whether these securities have had gross unrealized losses for less than twelve months,
or for twelve months or longer.
Less than twelve months Twelve months or longer Total
(Dollars in millions) Fair Value
Gross
Unrealized
Losses Fair Value
Gross
Unrealized
Losses Fair Value
Gross
Unrealized
Losses
Available-for-sale debt securities as of December 31, 2007
Mortgage-backed securities
$10,103 $(438) $140,600 $(2,706) $150,703 $(3,144)
Foreign securities
357 (88) 2,129 (13) 2,486 (101)
Corporate/Agency bonds
127 (2) 2,181 (74) 2,308 (76)
Other taxable securities
622 (25) 712 (59) 1,334 (84)
Total taxable securities
11,209 (553) 145,622 (2,852) 156,831 (3,405)
Tax-exempt securities
2,563 (66) 505 (3) 3,068 (69)
Total temporarily-impaired available-for-sale debt securities
13,772 (619) 146,127 (2,855) 159,899 (3,474)
Temporarily-impaired available-for-sale marketable equity securities
2,353 (322) 57 (30) 2,410 (352)
Total temporarily-impaired available-for-sale securities
$16,125 $(941) $146,184 $(2,885) $162,309 $(3,826)
Available-for-sale debt securities as of December 31, 2006
U.S. Treasury securities and agency debentures $ 387 $ (9) $ – $ – $ 387 $ (9)
Mortgage-backed securities 4,684 (128) 151,092 (4,676) 155,776 (4,804)
Foreign securities 45 (1) 6,908 (77) 6,953 (78)
Corporate/Agency bonds 4,199 (96) – – 4,199 (96)
Other taxable securities 1,253 (29) 287 (9) 1,540 (38)
Total taxable securities 10,568 (263) 158,287 (4,762) 168,855 (5,025)
Tax-exempt securities 811 (4) 1,271 (30) 2,082 (34)
Total temporarily-impaired available-for-sale debt securities 11,379 (267) 159,558 (4,792) 170,937 (5,059)
Temporarily-impaired available-for-sale marketable equity securities 244 (10) – – 244 (10)
Total temporarily-impaired available-for-sale securities $11,623 $(277) $159,558 $(4,792) $171,181 $(5,069)
Management evaluates securities for other-than-temporary impair-
ment on a quarterly basis, and more frequently when conditions warrant
such evaluation. Factors considered in determining whether an impairment
is other-than-temporary include (1) the length of time and the extent to
which the fair value has been less than cost, (2) the financial condition
and near-term prospects of the issuer, and (3) the intent and ability of the
Corporation to hold the investment for a period of time sufficient to allow
for any anticipated recovery in fair value.
At December 31, 2007, the amortized cost of approximately 7,000
securities in AFS securities exceeded their fair value by $3.8 billion.
Included in the $3.8 billion of gross unrealized losses on AFS securities at
December 31, 2007, was $941 million of gross unrealized losses that
have existed for less than twelve months and $2.9 billion of gross unreal-
ized losses that have existed for a period of twelve months or longer. Of
the gross unrealized losses existing for twelve months or longer, $2.7 bil-
lion, or 94 percent, of the gross unrealized loss is related to approximately
800 mortgage-backed securities. These securities are predominantly guar-
anteed by either the Federal National Mortgage Association (Fannie Mae),
Federal Home Loan Mortgage Corporation (Freddie Mac) or Government
National Mortgage Association (GNMA). The gross unrealized losses on
these mortgage-backed securities are due to overall increases in market
interest rates subsequent to purchase. The Corporation has the ability and
intent to hold these securities for a period of time sufficient to recover all
gross unrealized losses. Accordingly, the Corporation has not recognized
any other-than-temporary impairment for these securities.
The Corporation had investments in securities from Fannie Mae and
Freddie Mac that exceeded 10 percent of consolidated shareholders’
equity as of December 31, 2007 and 2006. Those investments had fair
values of $100.8 billion and $43.2 billion at December 31, 2007, and
$109.9 billion and $42.0 billion at December 31, 2006. In addition, these
investments had total amortized costs of $102.9 billion and $43.9 billion
at December 31, 2007, and $113.5 billion and $43.3 billion at
December 31, 2006. As disclosed in the preceding paragraph, the Corpo-
ration has not recognized any other-than-temporary impairment for these
securities.
The Corporation recognized $398 million of impairment losses on
AFS debt securities during 2007. No such losses were recognized during
2006 or 2005.
Securities are pledged or assigned to secure borrowed funds, govern-
ment and trust deposits and for other purposes. The carrying value of
pledged securities was $107.4 billion and $83.8 billion at December 31,
2007 and 2006.
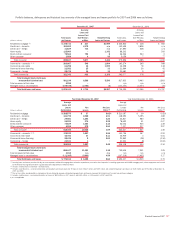
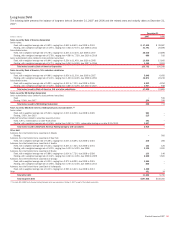
The expected maturity distribution of the Corporation’s mortgage-
backed securities and the contractual maturity distribution of the Corpo-
ration’s other debt securities, and the yields of its AFS debt securities
portfolio at December 31, 2007 are summarized in the following table.
Actual maturities may differ from the contractual or expected maturities
shown in the following table since borrowers may have the right to prepay
obligations with or without prepayment penalties.
132
Bank of America 2007