Bank of America 2007 Annual Report Download - page 168
Download and view the complete annual report
Please find page 168 of the 2007 Bank of America annual report below. You can navigate through the pages in the report by either clicking on the pages listed below, or by using the keyword search tool below to find specific information within the annual report.-
 1
1 -
2
-
3
-
4
-
5
-
6
-
7
-
8
-
9
-
10
-
11
-
12
-
13
-
14
-
15
-
16
-
17
-
18
-
19
-
20
-
21
-
22
-
23
-
24
-
25
-
26
-
27
-
28
-
29
-
30
-
31
-
32
-
33
-
34
-
35
-
36
-
37
-
38
-
39
-
40
-
41
-
42
-
43
-
44
-
45
-
46
-
47
-
48
-
49
-
50
-
51
-
52
-
53
-
54
-
55
-
56
-
57
-
58
-
59
-
60
-
61
-
62
-
63
-
64
-
65
-
66
-
67
-
68
-
69
-
70
-
71
-
72
-
73
-
74
-
75
-
76
-
77
-
78
-
79
-
80
-
81
-
82
-
83
-
84
-
85
-
86
-
87
-
88
-
89
-
90
-
91
-
92
-
93
-
94
-
95
-
96
-
97
-
98
-
99
-
100
-
101
-
102
-
103
-
104
-
105
-
106
-
107
-
108
-
109
-
110
-
111
-
112
-
113
-
114
-
115
-
116
-
117
-
118
-
119
-
120
-
121
-
122
-
123
-
124
-
125
-
126
-
127
-
128
-
129
-
130
-
131
-
132
-
133
-
134
-
135
-
136
-
137
-
138
-
139
-
140
-
141
-
142
-
143
-
144
-
145
-
146
-
147
-
148
-
149
-
150
-
151
-
152
-
153
-
154
-
155
-
156
-
157
-
 158
158 -
 159
159 -
 160
160 -
 161
161 -
 162
162 -
 163
163 -
 164
164 -
 165
165 -
 166
166 -
 167
167 -
 168
168 -
 169
169 -
 170
170 -
 171
171 -
 172
172 -
 173
173 -
 174
174 -
 175
175 -
 176
176 -
 177
177 -
 178
178 -
179
 |
 |

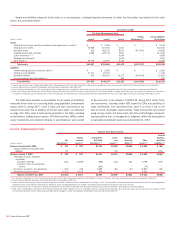
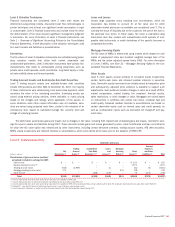
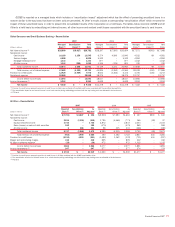
The table below summarizes changes in unrealized gains or losses recorded in earnings during 2007 for Level 3 assets and liabilities that are still held
at December 31, 2007. These amounts include changes in fair value of loans, loans held-for-sale and loan commitments for which the fair value option was
elected and changes in fair value for other instruments, including certain derivative contracts, trading account assets, AFS debt securities, MSRs, equity
investments and retained interests in securitizations, which were carried at fair value prior to the adoption of SFAS 159.
Level 3 Instruments Only
Changes in Unrealized Gains or Losses
(Dollars in millions)
Net
Derivatives
(1)
Trading
Account
Assets
(1)
Available-
for-Sale
Debt
Securities
(1)
Loans
and
Leases
(2)
Mortgage
Servicing
Rights
(1)
Other
Assets
(3)
Accrued
Expenses
and Other
Liabilities
(3)
Total
Changes in unrealized gains or losses
relating to assets still held at reporting
date for 2007:
Card income $ – $ – $ – $ – $ – $(136) $ – $ (136)
Equity investment income – – – – – (65) – (65)
Trading account losses (196) (2,857) – – – (58) (1) (3,112)
Mortgage banking income (loss) 139 – – – (43) (22) – 74
Other income – – (398) (167) – – (395) (960)
Total
$ (57) $(2,857) $(398) $(167) $(43) $(281) $(396) $(4,199)
(1) Amounts represented items which were carried at fair value prior to the adoption of SFAS 159.
(2) Amounts represented items for which the Corporation had elected the fair value option under SFAS 159.
(3) Amounts represented items which were carried at fair value prior to the adoption of SFAS 159 and certain portfolios of loans held-for-sale for which the Corporation had elected the fair value option under SFAS 159.
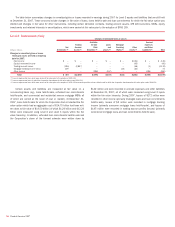
Certain assets and liabilities are measured at fair value on a
non-recurring basis (e.g., loans held-for-sale, unfunded loan commitments
held-for-sale, and commercial and residential reverse mortgage MSRs all
of which are carried at the lower of cost or market). At December 31,
2007, loans held-for-sale for which the Corporation had not elected the fair
value option which had an aggregate cost of $14.70 billion had been writ-
ten down to fair value of $14.50 billion (of which $1.20 billion and $13.30
billion were measured using Level 2 and Level 3 inputs within the fair
value hierarchy). In addition, unfunded loan commitments held-for-sale and
the Corporation’s share of the forward calendar were written down by
$142 million and were recorded in accrued expenses and other liabilities
at December 31, 2007, all of which were measured using Level 3 inputs
within the fair value hierarchy. During 2007, losses of $172 million were
recorded in other income (primarily leveraged loans and loan commitments
held-for-sale), losses of $2 million were recorded in mortgage banking
income (primarily consumer mortgage loans held-for-sale), and losses of
$145 million were recorded in trading account profits (losses) (primarily
commercial mortgage loans and loan commitments held-for-sale).
166
Bank of America 2007