Bank of America 2007 Annual Report Download - page 116
Download and view the complete annual report
Please find page 116 of the 2007 Bank of America annual report below. You can navigate through the pages in the report by either clicking on the pages listed below, or by using the keyword search tool below to find specific information within the annual report.-
 1
1 -
2
-
3
-
4
-
5
-
6
-
7
-
8
-
9
-
10
-
11
-
12
-
13
-
14
-
15
-
16
-
17
-
18
-
19
-
20
-
21
-
22
-
23
-
24
-
25
-
26
-
27
-
28
-
29
-
30
-
31
-
32
-
33
-
34
-
35
-
36
-
37
-
38
-
39
-
40
-
41
-
42
-
43
-
44
-
45
-
46
-
47
-
48
-
49
-
50
-
51
-
52
-
53
-
54
-
55
-
56
-
57
-
58
-
59
-
60
-
61
-
62
-
63
-
64
-
65
-
66
-
67
-
68
-
69
-
70
-
71
-
72
-
73
-
74
-
75
-
76
-
77
-
78
-
79
-
80
-
81
-
82
-
83
-
84
-
85
-
86
-
87
-
88
-
89
-
90
-
91
-
92
-
93
-
94
-
95
-
96
-
97
-
98
-
99
-
100
-
101
-
102
-
103
-
104
-
105
-
 106
106 -
 107
107 -
 108
108 -
 109
109 -
 110
110 -
 111
111 -
 112
112 -
 113
113 -
 114
114 -
 115
115 -
 116
116 -
 117
117 -
 118
118 -
 119
119 -
 120
120 -
 121
121 -
 122
122 -
 123
123 -
 124
124 -
 125
125 -
 126
126 -
127
-
128
-
129
-
130
-
131
-
132
-
133
-
134
-
135
-
136
-
137
-
138
-
139
-
140
-
141
-
142
-
143
-
144
-
145
-
146
-
147
-
148
-
149
-
150
-
151
-
152
-
153
-
154
-
155
-
156
-
157
-
158
-
159
-
160
-
161
-
162
-
163
-
164
-
165
-
166
-
167
-
168
-
169
-
170
-
171
-
172
-
173
-
174
-
175
-
176
-
177
-
178
-
179
 |
 |

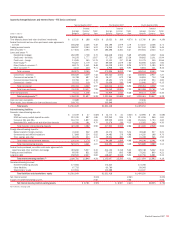
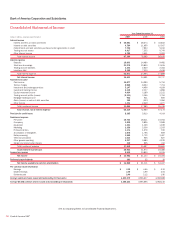
Bank of America Corporation and Subsidiaries
Consolidated Statement of Income
Year Ended December 31
(Dollars in millions, except per share information) 2007 2006 2005
Interest income
Interest and fees on loans and leases
$ 55,681
$ 48,274 $ 34,843
Interest on debt securities
9,784
11,655 10,937
Federal funds sold and securities purchased under agreements to resell
7,722
7,823 5,012
Trading account assets
9,417
7,232 5,743
Other interest income
4,700
3,601 2,091
Total interest income
87,304
78,585 58,626
Interest expense
Deposits
18,093
14,480 9,492
Short-term borrowings
21,975
19,840 11,615
Trading account liabilities
3,444
2,640 2,364
Long-term debt
9,359
7,034 4,418
Total interest expense
52,871
43,994 27,889
Net interest income
34,433
34,591 30,737
Noninterest income
Card income
14,077
14,290 5,753
Service charges
8,908
8,224 7,704
Investment and brokerage services
5,147
4,456 4,184
Investment banking income
2,345
2,317 1,856
Equity investment income
4,064
3,189 2,212
Trading account profits (losses)
(5,131)
3,166 1,763
Mortgage banking income
902
541 805
Gains (losses) on sales of debt securities
180
(443) 1,084
Other income
1,394
2,249 1,077
Total noninterest income
31,886
37,989 26,438
Total revenue, net of interest expense
66,319
72,580 57,175
Provision for credit losses
8,385
5,010 4,014
Noninterest expense
Personnel
18,753
18,211 15,054
Occupancy
3,038
2,826 2,588
Equipment
1,391
1,329 1,199
Marketing
2,356
2,336 1,255
Professional fees
1,174
1,078 930
Amortization of intangibles
1,676
1,755 809
Data processing
1,962
1,732 1,487
Telecommunications
1,013
945 827
Other general operating
5,237
4,580 4,120
Merger and restructuring charges
410
805 412
Total noninterest expense
37,010
35,597 28,681
Income before income taxes
20,924
31,973 24,480
Income tax expense
5,942
10,840 8,015
Net income
$ 14,982
$ 21,133 $ 16,465
Preferred stock dividends
182
22 18
Net income available to common shareholders
$ 14,800
$ 21,111 $ 16,447
Per common share information
Earnings
$ 3.35
$ 4.66 $ 4.10
Diluted earnings
3.30
4.59 4.04
Dividends paid
2.40
2.12 1.90
Average common shares issued and outstanding (in thousands)
4,423,579
4,526,637 4,008,688
Average diluted common shares issued and outstanding (in thousands)
4,480,254
4,595,896 4,068,140
See accompanying Notes to Consolidated Financial Statements.
114
Bank of America 2007