Bank of America 2007 Annual Report Download - page 131
Download and view the complete annual report
Please find page 131 of the 2007 Bank of America annual report below. You can navigate through the pages in the report by either clicking on the pages listed below, or by using the keyword search tool below to find specific information within the annual report.-
 1
1 -
2
-
3
-
4
-
5
-
6
-
7
-
8
-
9
-
10
-
11
-
12
-
13
-
14
-
15
-
16
-
17
-
18
-
19
-
20
-
21
-
22
-
23
-
24
-
25
-
26
-
27
-
28
-
29
-
30
-
31
-
32
-
33
-
34
-
35
-
36
-
37
-
38
-
39
-
40
-
41
-
42
-
43
-
44
-
45
-
46
-
47
-
48
-
49
-
50
-
51
-
52
-
53
-
54
-
55
-
56
-
57
-
58
-
59
-
60
-
61
-
62
-
63
-
64
-
65
-
66
-
67
-
68
-
69
-
70
-
71
-
72
-
73
-
74
-
75
-
76
-
77
-
78
-
79
-
80
-
81
-
82
-
83
-
84
-
85
-
86
-
87
-
88
-
89
-
90
-
91
-
92
-
93
-
94
-
95
-
96
-
97
-
98
-
99
-
100
-
101
-
102
-
103
-
104
-
105
-
106
-
107
-
108
-
109
-
110
-
111
-
112
-
113
-
114
-
115
-
116
-
117
-
118
-
119
-
120
-
 121
121 -
 122
122 -
 123
123 -
 124
124 -
 125
125 -
 126
126 -
 127
127 -
 128
128 -
 129
129 -
 130
130 -
 131
131 -
 132
132 -
 133
133 -
 134
134 -
 135
135 -
 136
136 -
 137
137 -
 138
138 -
 139
139 -
 140
140 -
 141
141 -
142
-
143
-
144
-
145
-
146
-
147
-
148
-
149
-
150
-
151
-
152
-
153
-
154
-
155
-
156
-
157
-
158
-
159
-
160
-
161
-
162
-
163
-
164
-
165
-
166
-
167
-
168
-
169
-
170
-
171
-
172
-
173
-
174
-
175
-
176
-
177
-
178
-
179
 |
 |

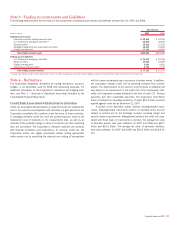
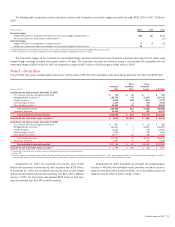
Note 3 – Trading Account Assets and Liabilities
The following table presents the fair values of the components of trading account assets and liabilities at December 31, 2007 and 2006.
December 31
(Dollars in millions) 2007 2006
Trading account assets
Corporate securities, trading loans and other
$ 55,360
$ 53,923
U.S. Government and agency securities
(1)
48,240
36,656
Equity securities
22,910
27,103
Mortgage trading loans and asset-backed securities
18,393
15,449
Foreign sovereign debt
17,161
19,921
Total trading account assets
$162,064
$153,052
Trading account liabilities
U.S. Government and agency securities
$ 35,375
$ 26,760
Equity securities
25,926
23,908
Foreign sovereign debt
9,292
9,261
Corporate securities and other
6,749
7,741
Total trading account liabilities
$ 77,342
$ 67,670
(1) Includes $21.5 billion and $22.7 billion at December 31, 2007 and 2006 of government-sponsored enterprise obligations that are not backed by the full faith and credit of the U.S. Government.
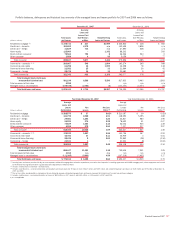
Note 4 – Derivatives
The Corporation designates derivatives as trading derivatives, economic
hedges, or as derivatives used for SFAS 133 accounting purposes. For
additional information on the Corporation’s derivatives and hedging activ-
ities, see Note 1 – Summary of Significant Accounting Principles to the
Consolidated Financial Statements.
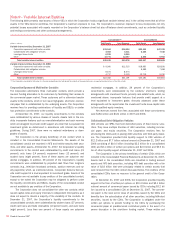
Credit Risk Associated with Derivative Activities
Credit risk associated with derivatives is measured as the net replacement
cost in the event the counterparties with contracts in a gain position to the
Corporation completely fail to perform under the terms of those contracts.
In managing derivative credit risk, both the current exposure, which is the
replacement cost of contracts on the measurement date, as well as an
estimate of the potential change in value of contracts over their remaining
lives are considered. The Corporation’s derivative activities are primarily
with financial institutions and corporations. To minimize credit risk, the
Corporation enters into legally enforceable master netting agreements
which reduce risk by permitting the closeout and netting of transactions
with the same counterparty upon occurrence of certain events. In addition,
the Corporation reduces credit risk by obtaining collateral from counter-
parties. The determination of the need for and the levels of collateral will
vary based on an assessment of the credit risk of the counterparty. Gen-
erally, the Corporation accepts collateral in the form of cash, U.S. Treasury
securities and other marketable securities. The Corporation held $34.2
billion of collateral on derivative positions, of which $21.3 billion could be
applied against credit risk at December 31, 2007.
A portion of the derivative activity involves exchange-traded instru-
ments. Exchange-traded instruments conform to standard terms and are
subject to policies set by the exchange involved, including margin and
security deposit requirements. Management believes the credit risk asso-
ciated with these types of instruments is minimal. The average fair value
of derivative assets, less cash collateral, for 2007 and 2006 was $29.7
billion and $24.2 billion. The average fair value of derivative liabilities,
less cash collateral, for 2007 and 2006 was $20.6 billion and $16.6 bil-
lion.
Bank of America 2007
129