Bank of America 2007 Annual Report Download - page 40
Download and view the complete annual report
Please find page 40 of the 2007 Bank of America annual report below. You can navigate through the pages in the report by either clicking on the pages listed below, or by using the keyword search tool below to find specific information within the annual report.-
 1
1 -
2
-
3
-
4
-
5
-
6
-
7
-
8
-
9
-
10
-
11
-
12
-
13
-
14
-
15
-
16
-
17
-
18
-
19
-
20
-
21
-
22
-
23
-
24
-
25
-
26
-
27
-
28
-
29
-
 30
30 -
 31
31 -
 32
32 -
 33
33 -
 34
34 -
 35
35 -
 36
36 -
 37
37 -
 38
38 -
 39
39 -
 40
40 -
 41
41 -
 42
42 -
 43
43 -
 44
44 -
 45
45 -
 46
46 -
 47
47 -
 48
48 -
 49
49 -
 50
50 -
51
-
52
-
53
-
54
-
55
-
56
-
57
-
58
-
59
-
60
-
61
-
62
-
63
-
64
-
65
-
66
-
67
-
68
-
69
-
70
-
71
-
72
-
73
-
74
-
75
-
76
-
77
-
78
-
79
-
80
-
81
-
82
-
83
-
84
-
85
-
86
-
87
-
88
-
89
-
90
-
91
-
92
-
93
-
94
-
95
-
96
-
97
-
98
-
99
-
100
-
101
-
102
-
103
-
104
-
105
-
106
-
107
-
108
-
109
-
110
-
111
-
112
-
113
-
114
-
115
-
116
-
117
-
118
-
119
-
120
-
121
-
122
-
123
-
124
-
125
-
126
-
127
-
128
-
129
-
130
-
131
-
132
-
133
-
134
-
135
-
136
-
137
-
138
-
139
-
140
-
141
-
142
-
143
-
144
-
145
-
146
-
147
-
148
-
149
-
150
-
151
-
152
-
153
-
154
-
155
-
156
-
157
-
158
-
159
-
160
-
161
-
162
-
163
-
164
-
165
-
166
-
167
-
168
-
169
-
170
-
171
-
172
-
173
-
174
-
175
-
176
-
177
-
178
-
179
 |
 |

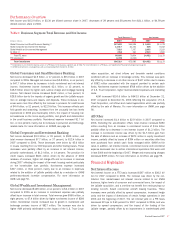
related to our CMAS business. For more information on net interest
income on a FTE basis, see Tables I and II beginning on page 98.
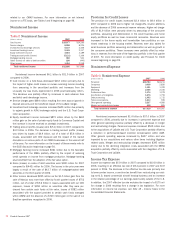
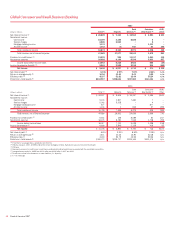
Noninterest Income
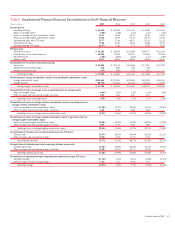
Table 2 Noninterest Income
(Dollars in millions) 2007 2006
Card income
$14,077
$14,290
Service charges
8,908
8,224
Investment and brokerage services
5,147
4,456
Investment banking income
2,345
2,317
Equity investment income
4,064
3,189
Trading account profits (losses)
(5,131)
3,166
Mortgage banking income
902
541
Gains (losses) on sales of debt securities
180
(443)
Other income
1,394
2,249
Total noninterest income
$31,886
$37,989
Noninterest income decreased $6.1 billion to $31.9 billion in 2007
compared to 2006.
ŠCard income on a held basis decreased $213 million primarily due to
the impact of higher credit losses on excess servicing income resulting
from seasoning in the securitized portfolio and increases from the
unusually low loss levels experienced in 2006 post bankruptcy reform.
This decrease was partially offset by increases in cash advance fees
and debit card interchange income.
ŠService charges grew $684 million resulting from new account growth in
deposit accounts and the beneficial impact of the LaSalle merger.
ŠInvestment and brokerage services increased $691 million due primarily
to organic growth in AUM, brokerage activity and the U.S. Trust Corpo-
ration acquisition.
ŠEquity investment income increased $875 million driven by the $600
million gain on the sale of private equity funds to Conversus Capital and
the increase in income received on strategic investments.
ŠTrading account profits (losses) were $(5.1) billion in 2007 compared to
$3.2 billion in 2006. The decrease in trading account profits (losses)
was driven by losses of $4.9 billion, out of a total of $5.6 billion in
losses, associated with CDO exposure and the impact of the market
disruptions on various parts of our CMAS businesses in the second half
of the year. For more information on the impact of these events refer to
the GCIB discussion beginning on page 50.
ŠMortgage banking income increased $361 million due to the favorable
performance of the MSRs partially offset by the impact of widening
credit spreads on income from mortgage production. Mortgage banking
also benefited from the adoption of the fair value option.
ŠGains (losses) on sales of debt securities were $180 million for 2007
compared to $(443) million for 2006. The losses in the prior year were
largely a result of the sale of $43.7 billion of mortgage-backed debt
securities in the third quarter of 2006.
ŠOther income decreased $855 million as the $1.5 billion gain from the
sale of Marsico was more than offset by fourth quarter losses of $752
million, out of a total of $5.6 billion in losses associated with our CDO
exposure, losses of $394 million on securities after they were pur-
chased from certain cash funds at fair value, losses of $382 million
associated with the support provided to certain cash funds managed
within GWIM, and the absence of a $720 million gain on the sale of our
Brazilian operations recognized in 2006.
Provision for Credit Losses
The provision for credit losses increased $3.4 billion to $8.4 billion in
2007 compared to 2006 due to higher net charge-offs, reserve additions
and the absence of 2006 commercial reserve releases. Higher net charge-
offs of $1.9 billion were primarily driven by seasoning of the consumer
portfolios, seasoning and deterioration in the small business and home
equity portfolios as well as lower commercial recoveries. Reserves were
increased in the home equity and homebuilder loan portfolios on con-
tinued weakness in the housing market. Reserves were also added for
small business portfolio seasoning and deterioration as well as growth in
the consumer portfolios. These increases were partially offset by reduc-
tions in reserves from the sale of the Argentina portfolio in the first quarter
of 2007. For more information on credit quality, see Provision for Credit
Losses beginning on page 83.
Noninterest Expense
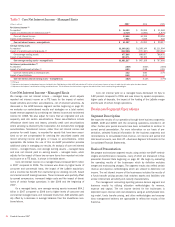
Table 3 Noninterest Expense
(Dollars in millions) 2007 2006
Personnel
$18,753
$18,211
Occupancy
3,038
2,826
Equipment
1,391
1,329
Marketing
2,356
2,336
Professional fees
1,174
1,078
Amortization of intangibles
1,676
1,755
Data processing
1,962
1,732
Telecommunications
1,013
945
Other general operating
5,237
4,580
Merger and restructuring charges
410
805
Total noninterest expense
$37,010
$35,597
Noninterest expense increased $1.4 billion to $37.0 billion in 2007
compared to 2006, primarily due to increases in personnel expense and
other general operating expense partially offset by a decrease in merger
and restructuring charges. Personnel expense increased $542 million due
to the acquisitions of LaSalle and U.S. Trust Corporation partially offset by
a reduction in performance-based incentive compensation within GCIB.
Other general operating expense increased by $657 million and was
impacted by our acquisitions and various other items including litigation-
related costs. Merger and restructuring charges decreased $395 million
mainly due to the declining integration costs associated with the MBNA
acquisition partially offset by costs associated with the integration of U.S.
Trust Corporation and LaSalle.
Income Tax Expense
Income tax expense was $5.9 billion in 2007 compared to $10.8 billion in
2006, resulting in an effective tax rate of 28.4 percent in 2007 and 33.9
percent in 2006. The decrease in the effective tax rate was primarily due
to lower pre-tax income, a one-time tax benefit from restructuring our exist-
ing non-U.S. based commercial aircraft leasing business and an increase
in the relative percentage of our earnings taxed solely outside of the U.S.
In addition, the 2007 effective tax rate excludes the impact of a $175 mil-
lion charge in 2006 resulting from a change in tax legislation. For more
information on income tax expense, see Note 18 – Income Taxes to the
Consolidated Financial Statements.
38
Bank of America 2007