Bank of America 2007 Annual Report Download - page 160
Download and view the complete annual report
Please find page 160 of the 2007 Bank of America annual report below. You can navigate through the pages in the report by either clicking on the pages listed below, or by using the keyword search tool below to find specific information within the annual report.-
 1
1 -
2
-
3
-
4
-
5
-
6
-
7
-
8
-
9
-
10
-
11
-
12
-
13
-
14
-
15
-
16
-
17
-
18
-
19
-
20
-
21
-
22
-
23
-
24
-
25
-
26
-
27
-
28
-
29
-
30
-
31
-
32
-
33
-
34
-
35
-
36
-
37
-
38
-
39
-
40
-
41
-
42
-
43
-
44
-
45
-
46
-
47
-
48
-
49
-
50
-
51
-
52
-
53
-
54
-
55
-
56
-
57
-
58
-
59
-
60
-
61
-
62
-
63
-
64
-
65
-
66
-
67
-
68
-
69
-
70
-
71
-
72
-
73
-
74
-
75
-
76
-
77
-
78
-
79
-
80
-
81
-
82
-
83
-
84
-
85
-
86
-
87
-
88
-
89
-
90
-
91
-
92
-
93
-
94
-
95
-
96
-
97
-
98
-
99
-
100
-
101
-
102
-
103
-
104
-
105
-
106
-
107
-
108
-
109
-
110
-
111
-
112
-
113
-
114
-
115
-
116
-
117
-
118
-
119
-
120
-
121
-
122
-
123
-
124
-
125
-
126
-
127
-
128
-
129
-
130
-
131
-
132
-
133
-
134
-
135
-
136
-
137
-
138
-
139
-
140
-
141
-
142
-
143
-
144
-
145
-
146
-
147
-
148
-
149
-
 150
150 -
 151
151 -
 152
152 -
 153
153 -
 154
154 -
 155
155 -
 156
156 -
 157
157 -
 158
158 -
 159
159 -
 160
160 -
 161
161 -
 162
162 -
 163
163 -
 164
164 -
 165
165 -
 166
166 -
 167
167 -
 168
168 -
 169
169 -
 170
170 -
171
-
172
-
173
-
174
-
175
-
176
-
177
-
178
-
179
 |
 |

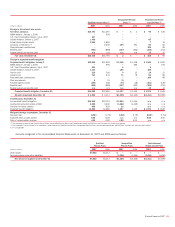
Projected Benefit Payments
Benefit payments projected to be made from the Qualified Pension Plans, the Nonqualified Pension Plans and the Postretirement Health and Life Plans are
as follows:
(Dollars in millions)
Qualified Pension
Plans
(1)
Nonqualified Pension
Plans
(2)
Postretirement Health and Life Plans
Net Payments
(3)
Medicare Subsidy
2008 $1,057 $105 $150 $(15)
2009 1,068 104 150 (15)
2010 1,059 103 152 (16)
2011 1,110 105 153 (16)
2012 1,105 103 152 (17)
2013 – 2017 5,324 479 735 (82)
(1) Benefit payments expected to be made from the plans’ assets.
(2) Benefit payments expected to be made from the Corporation’s assets.
(3) Benefit payments (net of retiree contributions) expected to be made from a combination of the plans’ and the Corporation’s assets.
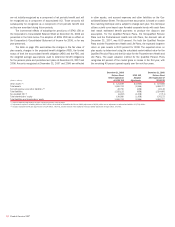
Defined Contribution Plans
The Corporation maintains qualified defined contribution retirement plans
and nonqualified defined contribution retirement plans.
The Corporation contributed approximately $420 million, $328 mil-
lion and $274 million for 2007, 2006 and 2005, in cash, respectively. At
December 31, 2007 and 2006, an aggregate of 93 million shares and
99 million shares of the Corporation’s common stock were held by the
401(k) Plans. Payments to the 401(k) plans for dividends on common
stock were $228 million, $216 million and $207 million during 2007,
2006 and 2005, respectively.
In addition, certain non-U.S. employees within the Corporation are
covered under defined contribution pension plans that are separately
administered in accordance with local laws.
Note 17 – Stock-Based Compensation Plans
On January 1, 2006, the Corporation adopted SFAS 123R under the
modified-prospective application.
The compensation cost recognized in income for the plans described
below was $1.2 billion, $1.0 billion and $805 million in 2007, 2006 and
2005, respectively. The related income tax benefit recognized in income
was $438 million, $382 million and $294 million for 2007, 2006 and
2005, respectively.
Prior to the adoption of SFAS 123R, awards granted to retirement-
eligible employees were expensed over the stated vesting period. SFAS
123R requires that the Corporation recognize stock compensation cost
immediately for any awards granted to retirement-eligible employees, or
over the vesting period or the period from the grant date to the date
retirement eligibility is achieved, whichever is shorter.
Prior to the adoption of SFAS 123R, the Corporation presented tax
benefits of deductions resulting from the exercise of stock options as
operating cash flows in the Consolidated Statement of Cash Flows. SFAS
123R requires the cash flows resulting from the tax benefits due to tax
deductions in excess of the compensation cost recognized for those
options (excess tax benefits) to be classified as financing cash flows. The
Corporation classified $254 million and $477 million in excess tax bene-
fits as a financing cash inflow for 2007 and 2006.
Prior to January 1, 2006, the Corporation estimated the fair value of
stock options granted on the date of grant using the Black-Scholes option-
pricing model. On January 1, 2006, the Corporation began using a lattice
option-pricing model to estimate the grant date fair value of stock options
granted. The following table presents the assumptions used to estimate
the fair value of stock options granted on the date of grant using the lat-
tice option-pricing model for 2007 and 2006. Lattice option-pricing models
incorporate ranges of assumptions for inputs and those ranges are
disclosed in the table below. The risk-free rate for periods within the con-
tractual life of the stock option is based on the U.S. Treasury yield curve in
effect at the time of grant. Expected volatilities are based on implied vola-
tilities from traded stock options on the Corporation’s common stock,
historical volatility of the Corporation’s common stock, and other factors.
The Corporation uses historical data to estimate stock option exercise and
employee termination within the model. The expected term of stock
options granted is derived from the output of the model and represents
the period of time that stock options granted are expected to be out-
standing. The table below also includes the assumptions used to estimate
the fair value of stock options granted on the date of grant using the
Black-Scholes option-pricing model for 2005. The estimates of fair value
from these models are theoretical values for stock options and changes in
the assumptions used in the models could result in materially different fair
value estimates. The actual value of the stock options will depend on the
market value of the Corporation’s common stock when the stock options
are exercised.
2007 2006 2005
Risk-free interest rate
4.72 – 5.16%
4.59 – 4.70% 3.94%
Dividend yield
4.40
4.50 4.60
Expected volatility
16.00 – 27.00
17.00 – 27.00 20.53
Weighted average volatility
19.70
20.30 n/a
Expected lives (years)
6.5
6.5 6
n/a = not applicable
The Corporation has equity compensation plans that were approved
by its shareholders. These plans are the Key Employee Stock Plan and the
Key Associate Stock Plan. Descriptions of the material features of these
plans follow.
158
Bank of America 2007