Bank of America 2004 Annual Report Download - page 113
Download and view the complete annual report
Please find page 113 of the 2004 Bank of America annual report below. You can navigate through the pages in the report by either clicking on the pages listed below, or by using the keyword search tool below to find specific information within the annual report.-
 1
1 -
2
-
3
-
4
-
5
-
6
-
7
-
8
-
9
-
10
-
11
-
12
-
13
-
14
-
15
-
16
-
17
-
18
-
19
-
20
-
21
-
22
-
23
-
24
-
25
-
26
-
27
-
28
-
29
-
30
-
31
-
32
-
33
-
34
-
35
-
36
-
37
-
38
-
39
-
40
-
41
-
42
-
43
-
44
-
45
-
46
-
47
-
48
-
49
-
50
-
51
-
52
-
53
-
54
-
55
-
56
-
57
-
58
-
59
-
60
-
61
-
62
-
63
-
64
-
65
-
66
-
67
-
68
-
69
-
70
-
71
-
72
-
73
-
74
-
75
-
76
-
77
-
78
-
79
-
80
-
81
-
82
-
83
-
84
-
85
-
86
-
87
-
88
-
89
-
90
-
91
-
92
-
93
-
94
-
95
-
96
-
97
-
98
-
99
-
100
-
101
-
102
-
 103
103 -
 104
104 -
 105
105 -
 106
106 -
 107
107 -
 108
108 -
 109
109 -
 110
110 -
 111
111 -
 112
112 -
 113
113 -
 114
114 -
 115
115 -
 116
116 -
 117
117 -
 118
118 -
 119
119 -
 120
120 -
 121
121 -
 122
122 -
 123
123 -
124
-
125
-
126
-
127
-
128
-
129
-
130
-
131
-
132
-
133
-
134
-
135
-
136
-
137
-
138
-
139
-
140
-
141
-
142
-
143
-
144
-
145
-
146
-
147
-
148
-
149
-
150
-
151
-
152
-
153
-
154
 |
 |

112 BANK OF AMERICA 2004
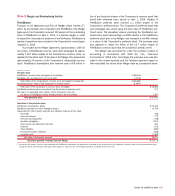
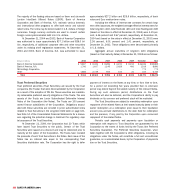
Derivatives(1)
December 31 FleetBoston
2004 2003 April 1, 2004
■■■■■■■■■■■
Contract/ Credit Contract/ Credit Contract/ Credit
(Dollars in millions) Notional Risk Notional Risk Notional Risk
■■■■■■■■■■■
Interest rate contracts
Swaps $ 11,597,813 $ 12,705 $8,873,600 $ 14,893 $105,366 $1,671
Futures and forwards 1,833,216 332 2,437,907 633 18,383 2
Written options 988,253 – 1,174,014 – 104,118 –
Purchased options 1,243,809 4,840 1,132,486 3,471 159,408 91
Foreign exchange contracts
Swaps 305,999 7,859 260,210 4,473 9,928 307
Spot, futures and forwards 956,995 3,593 775,105 4,202 33,941 403
Written options 167,225 – 138,474 – 2,854 –
Purchased options 163,243 679 133,512 669 2,776 58
Equity contracts
Swaps 34,130 1,039 30,850 364 1,026 127
Futures and forwards 4,078 – 3,234 – – –
Written options 37,080 – 25,794 – 779 –
Purchased options 32,893 5,741 24,119 5,370 811 55
Commodity contracts
Swaps 10,480 2,099 15,491 1,554 – –
Futures and forwards 6,307 6 5,726 – 275 –
Written options 9,270 – 11,695 – – –
Purchased options 5,535 301 7,223 294 – –
Credit derivatives 499,741 430 136,788 584 29,763 75
■■■■■■■■■■■
Credit risk before cash collateral 39,624 36,507 2,789
Less: Cash collateral held 9,389 7,498 96
■■■■■■■■■■■
Total derivative assets $ 30,235 $ 29,009 $2,693
n■■■■■■■■■■
■■■■■■■■■■■
(1) Includes both long and short derivative positions.
The following table presents the contract/notional and credit
risk amounts at December 31, 2004 and 2003 of the Corporation’s
derivative positions held for trading and hedging purposes. These
derivative positions are primarily executed in the over-the-counter mar-
ket. The credit risk amounts take into consideration the effects of
legally enforceable master netting agreements, and on an aggregate
basis have been reduced by the cash collateral held against
Derivative Assets. At December 31, 2004 and 2003, the cash collat-
eral held against Derivative Assets on the Consolidated Balance
Sheet was $9.4 billion and $7.5 billion, respectively. In addition, at
December 31, 2004 and 2003, the cash collateral placed against
Derivative Liabilities was $6.0 billion and $9.5 billion, respectively.