Bank of America 2004 Annual Report Download - page 32
Download and view the complete annual report
Please find page 32 of the 2004 Bank of America annual report below. You can navigate through the pages in the report by either clicking on the pages listed below, or by using the keyword search tool below to find specific information within the annual report.-
 1
1 -
2
-
3
-
4
-
5
-
6
-
7
-
8
-
9
-
10
-
11
-
12
-
13
-
14
-
15
-
16
-
17
-
18
-
19
-
20
-
21
-
 22
22 -
 23
23 -
 24
24 -
 25
25 -
 26
26 -
 27
27 -
 28
28 -
 29
29 -
 30
30 -
 31
31 -
 32
32 -
 33
33 -
 34
34 -
 35
35 -
 36
36 -
 37
37 -
 38
38 -
 39
39 -
 40
40 -
 41
41 -
 42
42 -
43
-
44
-
45
-
46
-
47
-
48
-
49
-
50
-
51
-
52
-
53
-
54
-
55
-
56
-
57
-
58
-
59
-
60
-
61
-
62
-
63
-
64
-
65
-
66
-
67
-
68
-
69
-
70
-
71
-
72
-
73
-
74
-
75
-
76
-
77
-
78
-
79
-
80
-
81
-
82
-
83
-
84
-
85
-
86
-
87
-
88
-
89
-
90
-
91
-
92
-
93
-
94
-
95
-
96
-
97
-
98
-
99
-
100
-
101
-
102
-
103
-
104
-
105
-
106
-
107
-
108
-
109
-
110
-
111
-
112
-
113
-
114
-
115
-
116
-
117
-
118
-
119
-
120
-
121
-
122
-
123
-
124
-
125
-
126
-
127
-
128
-
129
-
130
-
131
-
132
-
133
-
134
-
135
-
136
-
137
-
138
-
139
-
140
-
141
-
142
-
143
-
144
-
145
-
146
-
147
-
148
-
149
-
150
-
151
-
152
-
153
-
154
 |
 |

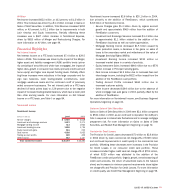
Nonperforming assets were 0.47% of total loans,
leases and foreclosed properties, or $2.46 billion, as of
December 31, 2004. This compared to 0.81%, or $3.02
billion, on December 31, 2003.
The allowance for loan and lease losses stood at
1.65% of loans and leases, or $8.63 billion, on December
31, 2004. This compared to 1.66%, or $6.16 billion, on
December 31, 2003. Criticized exposure declined from
$12.7 billion or 5.9% of total utilized commercial exposure
in 2003, to $10.2 billion or 3.4% in 2004.
Capital
Bank of America’s capital position remained strong in
2004. Total shareholders’ equity was $99.6 billion at
December 31, 2004, representing 9% of period-end assets
of $1.1 trillion. The Tier 1 capital ratio rose to 8.1% from
7.9% at the end of 2003.
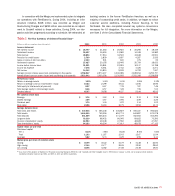
Business segments
Global Consumer and Small Business Banking earned
$6.55 billion. In addition to adding Fleet, this segment
achieved strong growth in checking and savings
accounts, which helped to drive double-digit growth in
deposit balances. Home equity and credit card loan
outstandings grew. Mortgage results were adversely
affected by higher interest rates, which significantly
reduced refinance volumes, and by adjustments to the
value of mortgage servicing rights.
Global Business and Financial Services earned
$2.83 billion. The main drivers of this segment’s perform-
ance were significant improvements in credit quality,
which resulted in negative provision expense. Excluding
the impact of Fleet, loans grew modestly during the year
and deposits also rose. Treasury management fee growth
also contributed to higher net income.
Global Capital Markets and Investment Banking
earned $1.95 billion in 2004 and had negative provision
expense due to improved credit quality. Excluding the
impact of Fleet, investment banking income increased,
reflecting the company’s continued buildout of that
platform, and trading-related revenue also rose.
Results were adversely impacted by the mutual fund
settlement.
Global Wealth and Investment Management
earned $1.58 billion. Excluding the addition of Fleet,
growth in assets under management and earnings was
driven by strong performance in the credit portfolios of
Premier Banking and The Private Bank and increased
market valuations in the asset management portfolio.
Results were adversely impacted by the mutual fund
settlement.
BANK OF AMERICA 2004 31