Bank of America 2004 Annual Report Download - page 97
Download and view the complete annual report
Please find page 97 of the 2004 Bank of America annual report below. You can navigate through the pages in the report by either clicking on the pages listed below, or by using the keyword search tool below to find specific information within the annual report.-
 1
1 -
2
-
3
-
4
-
5
-
6
-
7
-
8
-
9
-
10
-
11
-
12
-
13
-
14
-
15
-
16
-
17
-
18
-
19
-
20
-
21
-
22
-
23
-
24
-
25
-
26
-
27
-
28
-
29
-
30
-
31
-
32
-
33
-
34
-
35
-
36
-
37
-
38
-
39
-
40
-
41
-
42
-
43
-
44
-
45
-
46
-
47
-
48
-
49
-
50
-
51
-
52
-
53
-
54
-
55
-
56
-
57
-
58
-
59
-
60
-
61
-
62
-
63
-
64
-
65
-
66
-
67
-
68
-
69
-
70
-
71
-
72
-
73
-
74
-
75
-
76
-
77
-
78
-
79
-
80
-
81
-
82
-
83
-
84
-
85
-
86
-
 87
87 -
 88
88 -
 89
89 -
 90
90 -
 91
91 -
 92
92 -
 93
93 -
 94
94 -
 95
95 -
 96
96 -
 97
97 -
 98
98 -
 99
99 -
 100
100 -
 101
101 -
 102
102 -
 103
103 -
 104
104 -
 105
105 -
 106
106 -
 107
107 -
108
-
109
-
110
-
111
-
112
-
113
-
114
-
115
-
116
-
117
-
118
-
119
-
120
-
121
-
122
-
123
-
124
-
125
-
126
-
127
-
128
-
129
-
130
-
131
-
132
-
133
-
134
-
135
-
136
-
137
-
138
-
139
-
140
-
141
-
142
-
143
-
144
-
145
-
146
-
147
-
148
-
149
-
150
-
151
-
152
-
153
-
154
 |
 |

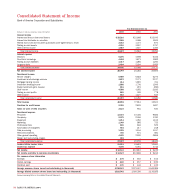
96 BANK OF AMERICA 2004
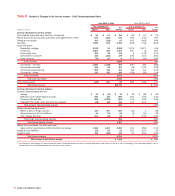
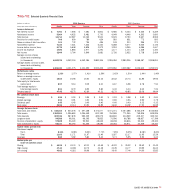
Year Ended December 31
(Dollars in millions, except per share information) 2004 2003 2002
Interest income
Interest and fees on loans and leases $ 28,216 $21,668 $22,030
Interest and dividends on securities 7,265 3,068 3,941
Federal funds sold and securities purchased under agreements to resell 2,043 1,373 870
Trading account assets 4,016 3,947 3,757
Other interest income 1,687 1,507 1,456
Total interest income 43,227 31,563 32,054
Interest expense
Deposits 6,275 4,908 5,434
Short-term borrowings 4,434 1,871 1,982
Trading account liabilities 1,317 1,286 1,260
Long-term debt 2,404 2,034 2,455
Total interest expense 14,430 10,099 11,131
Net interest income 28,797 21,464 20,923
Noninterest income
Service charges 6,989 5,618 5,276
Investment and brokerage services 3,627 2,371 2,237
Mortgage banking income 414 1,922 761
Investment banking income 1,886 1,736 1,545
Equity investment gains (losses) 861 215 (280)
Card income 4,588 3,052 2,620
Trading account profits 869 409 778
Other income 863 1,127 643
Total noninterest income 20,097 16,450 13,580
Total revenue 48,894 37,914 34,503
Provision for credit losses 2,769 2,839 3,697
Gains on sales of debt securities 2,123 941 630
Noninterest expense
Personnel 13,473 10,446 9,682
Occupancy 2,379 2,006 1,780
Equipment 1,214 1,052 1,124
Marketing 1,349 985 753
Professional fees 836 844 525
Amortization of intangibles 664 217 218
Data processing 1,325 1,104 1,017
Telecommunications 730 571 481
Other general operating 4,439 2,930 2,865
Merger and restructuring charges 618 ––
Total noninterest expense 27,027 20,155 18,445
Income before income taxes 21,221 15,861 12,991
Income tax expense 7,078 5,051 3,742
Net income $ 14,143 $10,810 $ 9,249
Net income available to common shareholders $ 14,127 $10,806 $ 9,244
Per common share information
Earnings $ 3.76 $ 3.63 $ 3.04
Diluted earnings $ 3.69 $ 3.57 $ 2.95
Dividends paid $ 1.70 $ 1.44 $ 1.22
Average common shares issued and outstanding (in thousands) 3,758,507 2,973,407 3,040,085
Average diluted common shares issued and outstanding (in thousands) 3,823,943 3,030,356 3,130,935
See accompanying Notes to Consolidated Financial Statements.
Consolidated Statement of Income
Bank of America Corporation and Subsidiaries