Bank of America 2004 Annual Report Download - page 49
Download and view the complete annual report
Please find page 49 of the 2004 Bank of America annual report below. You can navigate through the pages in the report by either clicking on the pages listed below, or by using the keyword search tool below to find specific information within the annual report.-
 1
1 -
2
-
3
-
4
-
5
-
6
-
7
-
8
-
9
-
10
-
11
-
12
-
13
-
14
-
15
-
16
-
17
-
18
-
19
-
20
-
21
-
22
-
23
-
24
-
25
-
26
-
27
-
28
-
29
-
30
-
31
-
32
-
33
-
34
-
35
-
36
-
37
-
38
-
 39
39 -
 40
40 -
 41
41 -
 42
42 -
 43
43 -
 44
44 -
 45
45 -
 46
46 -
 47
47 -
 48
48 -
 49
49 -
 50
50 -
 51
51 -
 52
52 -
 53
53 -
 54
54 -
 55
55 -
 56
56 -
 57
57 -
 58
58 -
 59
59 -
60
-
61
-
62
-
63
-
64
-
65
-
66
-
67
-
68
-
69
-
70
-
71
-
72
-
73
-
74
-
75
-
76
-
77
-
78
-
79
-
80
-
81
-
82
-
83
-
84
-
85
-
86
-
87
-
88
-
89
-
90
-
91
-
92
-
93
-
94
-
95
-
96
-
97
-
98
-
99
-
100
-
101
-
102
-
103
-
104
-
105
-
106
-
107
-
108
-
109
-
110
-
111
-
112
-
113
-
114
-
115
-
116
-
117
-
118
-
119
-
120
-
121
-
122
-
123
-
124
-
125
-
126
-
127
-
128
-
129
-
130
-
131
-
132
-
133
-
134
-
135
-
136
-
137
-
138
-
139
-
140
-
141
-
142
-
143
-
144
-
145
-
146
-
147
-
148
-
149
-
150
-
151
-
152
-
153
-
154
 |
 |

48 BANK OF AMERICA 2004
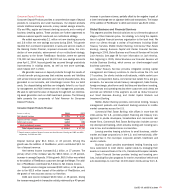
Partially offsetting these increases were declines in interest rate
and equities revenues. Interest rate revenues declined by $287 million,
or 30 percent, largely due to reduced corporate customer activity and
lower trading-related profits as a result of FRB tightening, uncertainty
related to the election, declining volatility in the options market and
more subdued economic growth than anticipated during the year.
Trading-related equities revenues declined by $149 million, or 43 percent.
Including commissions on equity transactions, trading-related equities
revenues declined $131 million, or 13 percent. The overall decline in
trading-related equities revenue was driven by net losses on a single
retained stock position in 2004 combined with the absence of gains
on a single position that we recorded in 2003.
Total trading-related revenues also included the cost associated
with credit portfolio hedges of $144 million in 2004, an improvement
of $186 million. The improvement was primarily due to stable
spreads in the first half of the year versus spreads tightening
throughout 2003.
The Provision for Credit Losses decreased $762 million to a
negative $459 million due to notable improvements in credit quality
in the large corporate portfolio partially due to the high levels of
liquidity in the capital markets, which enabled us to distribute paper
more readily. Also contributing to the decrease in the Provision for
Credit Losses was the reduction in net charge-offs of $311 million, or
71 percent. Additionally, nonperforming assets declined $589 million,
or 58 percent, to $424 million at December 31, 2004. For more
information, see Credit Risk Management beginning on page 58.
Noninterest Expense increased $1.2 billion, or 23 percent. This
increase was due, in part, to an increase in litigation-related charges
of $460 million, including the reversal of legal expenses previously
recorded in All Other that were reclassified to this segment. Also
impacting Noninterest Expense were higher incentive compensation
for market-based activities of $279 million and the mutual fund
settlement of $143 million.
Global Wealth and Investment Management
This segment provides tailored investment services to individual and
institutional clients in various stages and economic cycles. Our
clients are served through five major businesses, Premier Banking,
Banc of America Investments (BAI), The Private Bank, Columbia
Management Group (CMG) and Other Services, each offering specific
products and services based on clients’ needs.
Premier Banking joins with BAI, our full-service retail brokerage
business, to bring together personalized banking and investment
expertise through priority service with client-dedicated teams. These
teams provide comprehensive advice, cash management strategies,
and customized investment and financial planning solutions for mass
affluent clients. Mass affluent clients have a personal wealth profile
that includes investable assets plus a mortgage that exceeds
$250,000 or they have at least $100,000 of investable assets.
BAI serves 1.3 million accounts through a network of over
2,100 financial advisors throughout the U.S.
The Private Bank provides integrated wealth management solu-
tions to high-net-worth individuals, mid-market institutions and chari-
table organizations with investable assets greater than $3 million.
Services include investment, trust, banking and lending services.
During the third quarter of 2004, we announced a new business
designed to serve the needs of ultra high-net-worth individuals and
families. The goal is for this new business to provide a higher level
of contact and tailored wealth management solutions to clients with
investable assets greater than $50 million. We expect this business
to be rolled out during the first quarter of 2005.
CMG is an asset management organization primarily serving the
needs of institutional customers. CMG provides asset management
services, liquidity strategies and separate accounts. CMG also provides
mutual funds offering a full range of investment styles across an array
of products including equities, fixed income (taxable and nontaxable)
and cash products. In addition to its service of institutional clients,
CMG distributes its products and services to individuals through
The Private Bank,BAI and nonproprietary channels including other
brokerage firms.
Other Services include the Investment Services Group, which
provides products and services from traditional capital markets
products to alternative investments and Banc of America Specialist,a
New York Stock Exchange market-maker. Other Services also included
U.S. Clearing which provides retail clearing services to broker/dealers
and other correspondent firms. U.S. Clearing was sold in the fourth
quarter of 2004.
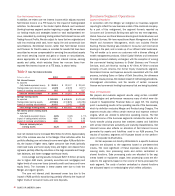
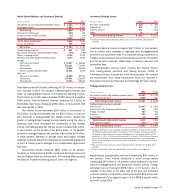
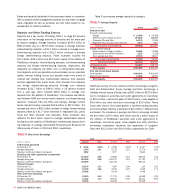
Global Wealth and Investment Management
(Dollars in millions) 2004 2003
Net interest income (fully taxable-equivalent basis) $ 2,854 $ 1,952
Noninterest income 3,064 2,078
Total revenue 5,918 4,030
Provision for credit losses (20) 11
Noninterest expense 3,449 2,101
Income before income taxes 2,489 1,918
Income tax expense 905 684
Net income $ 1,584 $ 1,234
Shareholder value added $ 782 $ 854
Net interest yield (fully taxable-equivalent basis) 3.35% 3.52%
Return on average equity 20.17 33.94
Efficiency ratio (fully taxable-equivalent basis) 58.28 52.11
Average:
Total loans and leases $ 44,049 $ 37,675
Total assets 91,443 58,606
Total deposits 83,049 53,996
Common equity/Allocated equity 7,854 3,637
Year end:
Total loans and leases 49,776 38,689
Total assets 121,974 69,370
Total deposits 111,107 62,730