Bank of America 2004 Annual Report Download - page 66
Download and view the complete annual report
Please find page 66 of the 2004 Bank of America annual report below. You can navigate through the pages in the report by either clicking on the pages listed below, or by using the keyword search tool below to find specific information within the annual report.-
 1
1 -
2
-
3
-
4
-
5
-
6
-
7
-
8
-
9
-
10
-
11
-
12
-
13
-
14
-
15
-
16
-
17
-
18
-
19
-
20
-
21
-
22
-
23
-
24
-
25
-
26
-
27
-
28
-
29
-
30
-
31
-
32
-
33
-
34
-
35
-
36
-
37
-
38
-
39
-
40
-
41
-
42
-
43
-
44
-
45
-
46
-
47
-
48
-
49
-
50
-
51
-
52
-
53
-
54
-
55
-
 56
56 -
 57
57 -
 58
58 -
 59
59 -
 60
60 -
 61
61 -
 62
62 -
 63
63 -
 64
64 -
 65
65 -
 66
66 -
 67
67 -
 68
68 -
 69
69 -
 70
70 -
 71
71 -
 72
72 -
 73
73 -
 74
74 -
 75
75 -
 76
76 -
77
-
78
-
79
-
80
-
81
-
82
-
83
-
84
-
85
-
86
-
87
-
88
-
89
-
90
-
91
-
92
-
93
-
94
-
95
-
96
-
97
-
98
-
99
-
100
-
101
-
102
-
103
-
104
-
105
-
106
-
107
-
108
-
109
-
110
-
111
-
112
-
113
-
114
-
115
-
116
-
117
-
118
-
119
-
120
-
121
-
122
-
123
-
124
-
125
-
126
-
127
-
128
-
129
-
130
-
131
-
132
-
133
-
134
-
135
-
136
-
137
-
138
-
139
-
140
-
141
-
142
-
143
-
144
-
145
-
146
-
147
-
148
-
149
-
150
-
151
-
152
-
153
-
154
 |
 |

BANK OF AMERICA 2004 65
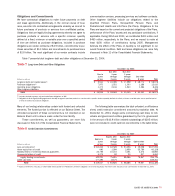
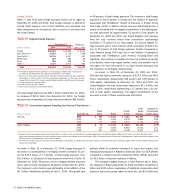
$193 million, respectively, of local country exposure net of local liabilities.
Nonperforming assets in Brazil were $38 million at December 31,
2004, compared to $39 million at December 31, 2003. For 2004 and
2003, net charge-offs totaled $59 million and $33 million, respectively.
We have risk mitigation instruments associated with certain
exposures for Brazil, including structured trade transactions intended
to mitigate transfer risk of $950 million and third party funding of
$286 million, resulting in our total foreign exposure net of risk mitigation
for Brazil of $2.2 billion.
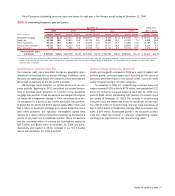
Our exposure in Argentina at December 31, 2004 and 2003,
included $286 million and $135 million, respectively, of traditional cross-
border credit exposure (Loans and Leases, letters of credit, etc.), and
$16 million and $24 million, respectively, of local country exposure net of
local liabilities. Also included in Argentina’s December 31, 2004 balance
were $89 million of securities. At December 31, 2004, Argentina
nonperforming assets, including securities, were $350 million compared to
$107 million at December 31, 2003. For 2004, net recoveries for Argentina
totaled $3 million compared to net charge-offs of $82 million in 2003.
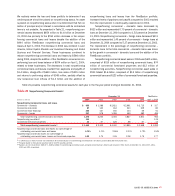
At December 31, 2004, 41 percent of the emerging markets
exposure was in Asia Pacific compared to 55 percent at December
31, 2003. Asia Pacific emerging markets exposure was largely
unchanged. Increases in Taiwan and Hong Kong were offset by
decreases in South Korea, Singapore and Other Asia Pacific. The
increase in Taiwan was attributable to higher short-term placements
with other financial institutions, and commercial loans and leases.
The increase in Hong Kong was due to higher swaps and derivatives
exposure to other financial institutions. Higher commercial loans and
leases also contributed to the increase in Hong Kong.
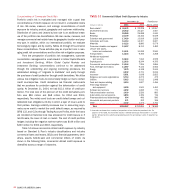
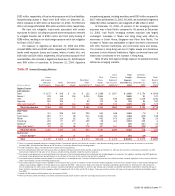
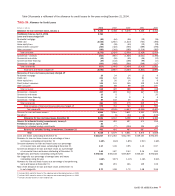
Table 19 sets forth regional foreign exposure to selected countries
defined as emerging markets.
Table 19
Selected Emerging Markets(1)
Local Total Increase/
Loans Total Country Foreign (Decrease) Fleet-
and Leases, Securities/ Cross- Exposure Exposure from Boston
and Loan Other Derivative Other border Net of Local December 31, December 31, April 1,
(Dollars in millions) Commitments Financing(2) Assets Investments(3,4) Exposure(5) Liabilities(6) 2004 2003 2004
■■■■■■■■■
Region/Country
Latin America
Brazil $ 1,179 $ 268 $ 19 $ 122 $ 1,588 $ 1,837 $ 3,425 $ 2,754 $ 3,838
Mexico(7) 578 148 136 2,004 2,866 – 2,866 83 570
Chile 215 122 1 3 341 839 1,180 1,049 1,186
Argentina 181 105 – 89 375 16 391 80 542
Other Latin America(8) 311 180 144 248 883 192 1,075 358 579
■■■■■■■■■
Total Latin America 2,464 823 300 2,466 6,053 2,884 8,937 4,324 6,715
■■■■■■■■■
Asia Pacific
India 311 268 140 225 944 548 1,492 (73) 9
South Korea 290 477 89 213 1,069 314 1,383 (235) 158
Taiwan 214 114 82 42 452 875 1,327 786 26
Hong Kong 225 57 307 129 718 401 1,119 249 6
Singapore 200 23 70 47 340 – 340 (227) 21
Other Asia Pacific(8) 81 80 58 278 497 157 654 (222) 50
■■■■■■■■■
Total Asia Pacific 1,321 1,019 746 934 4,020 2,295 6,315 278 270
■■■■■■■■■
Central and
Eastern Europe(8) 7 30 31 173 241 – 241 (29) –
■■■■■■■■■
Total $ 3,792 $ 1,872 $ 1,077 $ 3,573 $10,314 $ 5,179 $15,493 $ 4,573 $ 6,985
■■■■■■■■■
(1) There is no generally accepted definition of emerging markets. The definition that we use includes all countries in Latin America excluding Cayman Islands and Bermuda; all countries in Asia Pacific
excluding Japan, Australia and New Zealand; and all countries in Central and Eastern Europe excluding Greece.
(2) Includes acceptances, SBLCs, commercial letters of credit and formal guarantees.
(3) Amounts outstanding for Other Latin America and Other Asia Pacific have been reduced by $196 and $14, respectively, at December 31, 2004 and $173 and $13, respectively, at December 31, 2003.
Such amounts represent the fair value of U.S. Treasury securities held as collateral outside the country of exposure.
(4) Cross-border resale agreements are presented based on the domicile of the counterparty because the counterparty has the legal obligation for repayment. For regulatory reporting under FFIEC guidelines,
cross-border resale agreements are presented based on the domicile of the issuer of the securities that are held as collateral.
(5) Cross-border exposure includes amounts payable to us by borrowers or counterparties with a country of residence other than the one in which the credit is booked, regardless of the currency in which the
claim is denominated, consistent with FFIEC reporting rules.
(6) Local country exposure includes amounts payable to us by borrowers with a country of residence in which the credit is booked, regardless of the currency in which the claim is denominated. Management
subtracts local funding or liabilities from local exposures as allowed by the FFIEC. Total amount of local country exposure funded by local liabilities at December 31, 2004 was $17,189 compared to
$5,336 at December 31, 2003. Local country exposure funded by local liabilities at December 31, 2004 in Latin America and Asia Pacific was $9,098 and $8,091, respectively, of which $4,240 was in
Brazil, $3,432 in Hong Kong, $2,596 in Singapore, $1,662 in Argentina, $1,210 in Chile and $1,092 in Mexico. There were no other countries with local country exposure funded by local liabilities greater
than $500.
(7) Includes $1,859 related to GFSS acquired in the first quarter of 2003.
(8) Other Latin America, Other Asia Pacific, and Central and Eastern Europe include countries each with total foreign exposure of less than $300.