Bank of America 2004 Annual Report Download - page 147
Download and view the complete annual report
Please find page 147 of the 2004 Bank of America annual report below. You can navigate through the pages in the report by either clicking on the pages listed below, or by using the keyword search tool below to find specific information within the annual report.-
 1
1 -
2
-
3
-
4
-
5
-
6
-
7
-
8
-
9
-
10
-
11
-
12
-
13
-
14
-
15
-
16
-
17
-
18
-
19
-
20
-
21
-
22
-
23
-
24
-
25
-
26
-
27
-
28
-
29
-
30
-
31
-
32
-
33
-
34
-
35
-
36
-
37
-
38
-
39
-
40
-
41
-
42
-
43
-
44
-
45
-
46
-
47
-
48
-
49
-
50
-
51
-
52
-
53
-
54
-
55
-
56
-
57
-
58
-
59
-
60
-
61
-
62
-
63
-
64
-
65
-
66
-
67
-
68
-
69
-
70
-
71
-
72
-
73
-
74
-
75
-
76
-
77
-
78
-
79
-
80
-
81
-
82
-
83
-
84
-
85
-
86
-
87
-
88
-
89
-
90
-
91
-
92
-
93
-
94
-
95
-
96
-
97
-
98
-
99
-
100
-
101
-
102
-
103
-
104
-
105
-
106
-
107
-
108
-
109
-
110
-
111
-
112
-
113
-
114
-
115
-
116
-
117
-
118
-
119
-
120
-
121
-
122
-
123
-
124
-
125
-
126
-
127
-
128
-
129
-
130
-
131
-
132
-
133
-
134
-
135
-
136
-
 137
137 -
 138
138 -
 139
139 -
 140
140 -
 141
141 -
 142
142 -
 143
143 -
 144
144 -
 145
145 -
 146
146 -
 147
147 -
 148
148 -
 149
149 -
 150
150 -
 151
151 -
 152
152 -
 153
153 -
 154
154
 |
 |

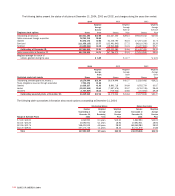
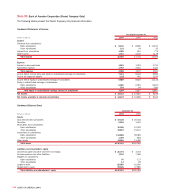
The following table presents Total Revenue and Net Income for 2004, 2003 and 2002, and Total Assets at December 31, 2004 and 2003
for each business segment, as well as All Other.
Business Segments
At and for the Year Ended December 31
Global Consumer and
Total Corporation Small Business Banking(1)
(Dollars in millions) 2004 2003 2002 2004 2003 2002
Net interest income (fully taxable-equivalent basis) $ 29,513 $ 22,107 $ 21,511 $ 17,308 $ 12,114 $ 11,411
Noninterest income 20,097 16,450 13,580 9,549 8,816 6,911
Total revenue 49,610 38,557 35,091 26,857 20,930 18,322
Provision for credit losses 2,769 2,839 3,697 3,341 1,678 1,521
Gains on sales of debt securities 2,123 941 630 117 13 20
Amortization of intangibles 664 217 218 463 147 143
Other noninterest expense 26,363 19,938 18,227 12,871 10,186 9,168
Income before income taxes 21,937 16,504 13,579 10,299 8,932 7,510
Income tax expense 7,794 5,694 4,330 3,751 3,226 2,769
Net income $ 14,143 $ 10,810 $ 9,249 $ 6,548 $ 5,706 $ 4,741
Period-end total assets $ 1,110,457 $ 719,483 $ 378,359 $ 264,578
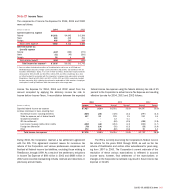
Global Business and Global Capital Markets and
Financial Services(1) Investment Banking(1)
(Dollars in millions) 2004 2003 2002 2004 2003 2002
Net interest income (fully taxable-equivalent basis) $ 4,593 $ 3,118 $ 3,195 $ 4,122 $ 4,289 $ 4,345
Noninterest income 2,129 1,399 1,214 4,927 4,045 3,856
Total revenue 6,722 4,517 4,409 9,049 8,334 8,201
Provision for credit losses (241) 458 453 (459) 303 768
Losses on sales of debt securities ––– (10) (14) (92)
Amortization of intangibles 82 21 21 44 24 29
Other noninterest expense 2,394 1,776 1,810 6,512 5,303 4,896
Income before income taxes 4,487 2,262 2,125 2,942 2,690 2,416
Income tax expense 1,654 791 756 992 896 814
Net income $ 2,833 $ 1,471 $ 1,369 $ 1,950 $ 1,794 $ 1,602
Period-end total assets $ 178,093 $ 107,791 $ 307,451 $ 225,839
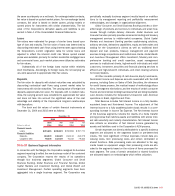
Global Wealth and
Investment Management(1) All Other
(Dollars in millions) 2004 2003 2002 2004 2003 2002
Net interest income (fully taxable-equivalent basis) $ 2,854 $ 1,952 $ 1,923 $ 636 $ 634 $ 637
Noninterest income 3,064 2,078 1,706 428 112 (107)
Total revenue 5,918 4,030 3,629 1,064 746 530
Provision for credit losses (20) 11 320 148 389 635
Gains on sales of debt securities –––2,016 942 702
Amortization of intangibles 62 20 20 13 55
Other noninterest expense 3,387 2,081 1,899 1,199 592 454
Income before income taxes 2,489 1,918 1,390 1,720 702 138
Income tax expense (benefit) 905 684 507 492 97 (516)
Net income $ 1,584 $ 1,234 $ 883 $ 1,228 $ 605 $ 654
Period-end total assets $ 121,974 $ 69,370 $ 124,580 $ 51,905
(1) There were no material intersegment revenues among the segments.
146 BANK OF AMERICA 2004