Bank of America 2004 Annual Report Download - page 117
Download and view the complete annual report
Please find page 117 of the 2004 Bank of America annual report below. You can navigate through the pages in the report by either clicking on the pages listed below, or by using the keyword search tool below to find specific information within the annual report.-
 1
1 -
2
-
3
-
4
-
5
-
6
-
7
-
8
-
9
-
10
-
11
-
12
-
13
-
14
-
15
-
16
-
17
-
18
-
19
-
20
-
21
-
22
-
23
-
24
-
25
-
26
-
27
-
28
-
29
-
30
-
31
-
32
-
33
-
34
-
35
-
36
-
37
-
38
-
39
-
40
-
41
-
42
-
43
-
44
-
45
-
46
-
47
-
48
-
49
-
50
-
51
-
52
-
53
-
54
-
55
-
56
-
57
-
58
-
59
-
60
-
61
-
62
-
63
-
64
-
65
-
66
-
67
-
68
-
69
-
70
-
71
-
72
-
73
-
74
-
75
-
76
-
77
-
78
-
79
-
80
-
81
-
82
-
83
-
84
-
85
-
86
-
87
-
88
-
89
-
90
-
91
-
92
-
93
-
94
-
95
-
96
-
97
-
98
-
99
-
100
-
101
-
102
-
103
-
104
-
105
-
106
-
 107
107 -
 108
108 -
 109
109 -
 110
110 -
 111
111 -
 112
112 -
 113
113 -
 114
114 -
 115
115 -
 116
116 -
 117
117 -
 118
118 -
 119
119 -
 120
120 -
 121
121 -
 122
122 -
 123
123 -
 124
124 -
 125
125 -
 126
126 -
 127
127 -
128
-
129
-
130
-
131
-
132
-
133
-
134
-
135
-
136
-
137
-
138
-
139
-
140
-
141
-
142
-
143
-
144
-
145
-
146
-
147
-
148
-
149
-
150
-
151
-
152
-
153
-
154
 |
 |

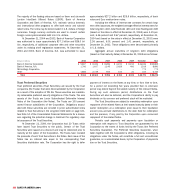
The components of realized gains and losses on sales of debt secu-
rities for 2004, 2003 and 2002 were:
(Dollars in millions) 2004 2003 2002
Gross gains $ 2,270 $1,246 $1,035
Gross losses (147) (305) (405)
Net gains on sales
of debt securities $ 2,123 $ 941 $ 630
The Income Tax Expense attributable to realized net gains on debt
securities sales was $788 million, $329 million and $220 million in
2004, 2003 and 2002, respectively.
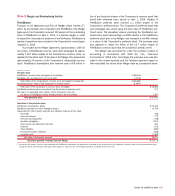
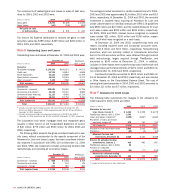
Note 6
Outstanding Loans and Leases
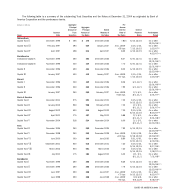
Outstanding loans and leases at December 31, 2004 and 2003 were:
December 31 FleetBoston
(Dollars in millions) 2004 2003 April 1, 2004
■■■■■■■■■
Consumer
Residential mortgage $178,103 $140,513 $ 34,571
Credit card 51,726 34,814 6,848
Home equity lines 50,126 23,859 13,799
Direct/Indirect consumer 40,513 33,415 6,113
Other consumer(1) 7,439 7,558 1,272
■■■■■■■■■
Total consumer 327,907 240,159 62,603
■■■■■■■■■
Commercial
Commercial – domestic 122,095 91,491 31,796
Commercial real estate(2) 32,319 19,367 9,982
Commercial lease financing 21,115 9,692 10,720
Commercial – foreign 18,401 10,754 9,160
■■■■■■■■■
Total commercial 193,930 131,304 61,658
■■■■■■■■■
Total $521,837 $371,463 $124,261
■■■■■■■■■
(1) Includes consumer finance, foreign consumer and consumer lease financing of $3,395,
$3,563 and $481 at December 31, 2004, respectively, and $3,905, $1,969 and $1,684 at
December 31, 2003, respectively.
(2) Includes domestic and foreign commercial real estate loans of $31,879 and $440 at
December 31, 2004, respectively, and $19,043 and $324 at December 31, 2003, respectively.
The Corporation sold whole mortgage loans and recognized gains
(losses) in Other Income on the Consolidated Statement of Income
of $(2) million, $772 million and $500 million for 2004, 2003 and
2002, respectively.
The following table presents the gross recorded investment in spe-
cific loans, without consideration to the specific component of the
Allowance for Loan and Lease Losses, that were considered individu-
ally impaired in accordance with SFAS 114 at December 31, 2004
and 2003. SFAS 114 impairment includes performing troubled debt
restructurings, and excludes all commercial leases.
December 31 FleetBoston
(Dollars in millions) 2004 2003 April 1, 2004
■■■■■■■■■
Commercial – domestic $ 868 $ 1,404 $ 349
Commercial real estate 87 153 85
Commercial – foreign 273 581 480
■■■■■■■■■
Total impaired loans $ 1,228 $2,138 $914
■■■■■■■■■
The average recorded investment in certain impaired loans for 2004,
2003 and 2002 was approximately $1.6 billion, $3.0 billion and $3.9
billion, respectively. At December 31, 2004 and 2003, the recorded
investment in impaired loans requiring an Allowance for Loan and
Lease Losses based on individual analysis per SFAS 114 guidelines
was $926 million and $2.0 billion, and the related Allowance for Loan
and Lease Losses was $202 million and $391 million, respectively.
For 2004, 2003 and 2002, Interest Income recognized on impaired
loans totaled $21 million, $105 million and $156 million, respec-
tively, all of which was recognized on a cash basis.
At December 31, 2004 and 2003, nonperforming loans and
leases, including impaired loans and nonaccrual consumer loans,
totaled $2.2 billion and $2.9 billion, respectively. Nonperforming
securities, which are primarily related to international securities
held in the AFS securities portfolio, were obtained through troubled
debt restructurings, largely acquired through FleetBoston, and
amounted to $140 million at December 31, 2004. In addition,
included in Other Assets were nonperforming loans held-for-sale and
leveraged lease partnership interests of $151 million and $202 mil-
lion at December 31, 2004 and 2003, respectively.
Foreclosed properties amounted to $102 million and $148 mil-
lion at December 31, 2004 and 2003, respectively, and are included
in Other Assets on the Consolidated Balance Sheet. The cost of
carrying foreclosed properties in 2004, 2003 and 2002 amounted to
$3 million, $3 million and $7 million, respectively.
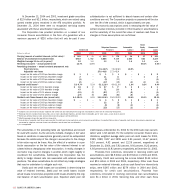
Note 7
Allowance for Credit Losses
The following table summarizes the changes in the allowance for
credit losses for 2004, 2003 and 2002:
(Dollars in millions) 2004 2003 2002
Allowance for loan and
lease losses, January 1 $ 6,163 $ 6,358 $ 6,278
FleetBoston balance, April 1, 2004 2,763 ––
Loans and leases charged off (4,092) (3,867) (4,460)
Recoveries of loans and leases
previously charged off 979 761 763
Net charge-offs (3,113) (3,106) (3,697)
Provision for loan and lease losses 2,868 2,916 3,801
Transfers(1) (55) (5) (24)
Allowance for loan and
lease losses, December 31 8,626 6,163 6,358
Reserve for unfunded lending
commitments, January 1 416 493 597
FleetBoston balance, April 1, 2004 85 ––
Provision for unfunded
lending commitments (99) (77) (104)
Reserve for unfunded lending
commitments, December 31 402 416 493
Total $ 9,028 $ 6,579 $ 6,851
(1) Includes primarily transfers to loans held-for-sale.
116 BANK OF AMERICA 2004