Bank of America 2004 Annual Report Download - page 67
Download and view the complete annual report
Please find page 67 of the 2004 Bank of America annual report below. You can navigate through the pages in the report by either clicking on the pages listed below, or by using the keyword search tool below to find specific information within the annual report.-
 1
1 -
2
-
3
-
4
-
5
-
6
-
7
-
8
-
9
-
10
-
11
-
12
-
13
-
14
-
15
-
16
-
17
-
18
-
19
-
20
-
21
-
22
-
23
-
24
-
25
-
26
-
27
-
28
-
29
-
30
-
31
-
32
-
33
-
34
-
35
-
36
-
37
-
38
-
39
-
40
-
41
-
42
-
43
-
44
-
45
-
46
-
47
-
48
-
49
-
50
-
51
-
52
-
53
-
54
-
55
-
56
-
 57
57 -
 58
58 -
 59
59 -
 60
60 -
 61
61 -
 62
62 -
 63
63 -
 64
64 -
 65
65 -
 66
66 -
 67
67 -
 68
68 -
 69
69 -
 70
70 -
 71
71 -
 72
72 -
 73
73 -
 74
74 -
 75
75 -
 76
76 -
 77
77 -
78
-
79
-
80
-
81
-
82
-
83
-
84
-
85
-
86
-
87
-
88
-
89
-
90
-
91
-
92
-
93
-
94
-
95
-
96
-
97
-
98
-
99
-
100
-
101
-
102
-
103
-
104
-
105
-
106
-
107
-
108
-
109
-
110
-
111
-
112
-
113
-
114
-
115
-
116
-
117
-
118
-
119
-
120
-
121
-
122
-
123
-
124
-
125
-
126
-
127
-
128
-
129
-
130
-
131
-
132
-
133
-
134
-
135
-
136
-
137
-
138
-
139
-
140
-
141
-
142
-
143
-
144
-
145
-
146
-
147
-
148
-
149
-
150
-
151
-
152
-
153
-
154
 |
 |

66 BANK OF AMERICA 2004
Commercial Portfolio Credit Quality Performance
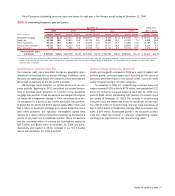
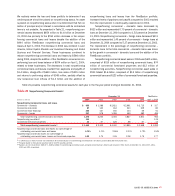
Overall commercial credit quality continued to improve in 2004 due
to an improving economy and high levels of liquidity in the capital
markets. All major commercial asset quality performance indicators
showed positive trends. Net charge-offs, nonperforming assets and
criticized exposure continued to decline. As presented in Table 20,
commercial criticized credit exposure decreased $2.4 billion, or 19
percent, to $10.2 billion at December 31, 2004. The net decrease was
driven by $16.8 billion of paydowns, payoffs, credit quality improve-
ments, loan sales and net charge-offs; partially offset by the addition
of $7.1 billion of FleetBoston commercial criticized exposure on April
1, 2004 and $7.3 billion of newly criticized exposure. The decrease
in 2004 was centered in Global Capital Markets and Investment
Banking, Global Business and Financial Services and Latin America.
These businesses combined to reduce commercial criticized exposure
by $2.2 billion during 2004, despite the addition of the FleetBoston
commercial criticized exposure balance of $6.8 billion on April 1,
2004, related to these businesses. Reductions were concentrated in the
utilities, aerospace and defense, and telecommunications industries.
Table 20 presents commercial criticized exposure at December
31, 2004 and 2003.
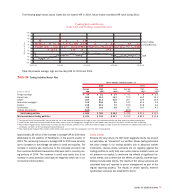
Table 20
Commercial Criticized Exposure(1)
December 31 FleetBoston
2004 2003 April 1, 2004
■■■■■■■■■■■■■
(Dollars in millions) Amount Percent(2) Amount Percent(2) Amount Percent(2)
■■■■■■■■■■■■■
Commercial – domestic $ 6,340 3.38% $ 8,044 5.73% $ 4,830 9.86%
Commercial real estate 1,028 2.54 983 3.89 406 4.08
Commercial lease financing 1,347 6.38 1,011 10.43 768 5.42
Commercial – foreign 1,534 3.12 2,612 6.97 1,057 10.01
■■■■■■■■■■■■■
Total commercial criticized exposure $10,249 3.44% $12,650 5.94% $ 7,061 8.44%
■■■■■■■■■■■■■
(1) Criticized exposure corresponds to the Special Mention, Substandard and Doubtful asset categories defined by regulatory authorities. Exposure amounts include loans and leases, SBLCs and financial
guarantees, derivative assets, assets held-for-sale and commercial letters of credit.
(2) Commercial criticized exposure is taken as a percentage of total commercial utilized exposure which includes loans and leases, SBLCs and financial guarantees, derivative assets, assets held-for-sale
and commercial letters of credit.