Bank of America 2004 Annual Report Download - page 82
Download and view the complete annual report
Please find page 82 of the 2004 Bank of America annual report below. You can navigate through the pages in the report by either clicking on the pages listed below, or by using the keyword search tool below to find specific information within the annual report.-
 1
1 -
2
-
3
-
4
-
5
-
6
-
7
-
8
-
9
-
10
-
11
-
12
-
13
-
14
-
15
-
16
-
17
-
18
-
19
-
20
-
21
-
22
-
23
-
24
-
25
-
26
-
27
-
28
-
29
-
30
-
31
-
32
-
33
-
34
-
35
-
36
-
37
-
38
-
39
-
40
-
41
-
42
-
43
-
44
-
45
-
46
-
47
-
48
-
49
-
50
-
51
-
52
-
53
-
54
-
55
-
56
-
57
-
58
-
59
-
60
-
61
-
62
-
63
-
64
-
65
-
66
-
67
-
68
-
69
-
70
-
71
-
 72
72 -
 73
73 -
 74
74 -
 75
75 -
 76
76 -
 77
77 -
 78
78 -
 79
79 -
 80
80 -
 81
81 -
 82
82 -
 83
83 -
 84
84 -
 85
85 -
 86
86 -
 87
87 -
 88
88 -
 89
89 -
 90
90 -
 91
91 -
 92
92 -
93
-
94
-
95
-
96
-
97
-
98
-
99
-
100
-
101
-
102
-
103
-
104
-
105
-
106
-
107
-
108
-
109
-
110
-
111
-
112
-
113
-
114
-
115
-
116
-
117
-
118
-
119
-
120
-
121
-
122
-
123
-
124
-
125
-
126
-
127
-
128
-
129
-
130
-
131
-
132
-
133
-
134
-
135
-
136
-
137
-
138
-
139
-
140
-
141
-
142
-
143
-
144
-
145
-
146
-
147
-
148
-
149
-
150
-
151
-
152
-
153
-
154
 |
 |

BANK OF AMERICA 2004 81
Goodwill
The nature of and accounting for Goodwill is discussed in detail in
Notes 1 and 9 of the Consolidated Financial Statements. Goodwill is
reviewed for potential impairment at the reporting unit level on an
annual basis, or in interim periods if events or circumstances indicate
a potential impairment. The reporting units utilized for this test were
those that are one level below the business segments identified on
page 40. The impairment test is performed in two phases. The first
step of the Goodwill impairment test compares the fair value of the
reporting unit with its carrying amount, including Goodwill. If the fair
value of the reporting unit exceeds its carrying amount, Goodwill of
the reporting unit is considered not impaired; however, if the carrying
amount of the reporting unit exceeds its fair value, an additional pro-
cedure must be performed. That additional procedure compares the
implied fair value of the reporting unit’s Goodwill (as defined in SFAS
142) with the carrying amount of that Goodwill. An impairment loss
is recorded to the extent that the carrying amount of Goodwill
exceeds its implied fair value.
The fair values of the reporting units were determined using a
combination of valuation techniques consistent with the income
approach and the market approach. For purposes of the income
approach, discounted cash flows were calculated by taking the net
present value of estimated cash flows using a combination of histor-
ical results, estimated future cash flows and an appropriate price to
earnings multiple. We use our internal forecasts to estimate future
cash flows and actual results may differ from forecasted results.
However, these differences have not been material and we believe
that this methodology provides a reasonable means to determine fair
values. Cash flows were discounted using a discount rate based on
expected equity return rates, which was 11 percent for 2004.
Expected rates of equity returns were estimated based on historical
market returns and risk/return rates for similar industries of the
reporting unit. For purposes of the market approach, valuations of
reporting units were based on actual comparable market transac-
tions and market earnings multiples for similar industries of the
reporting unit.
Our evaluations for the year ended December 31, 2004 indicated
there was no impairment of our Goodwill.
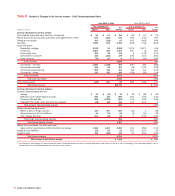
2003 Compared to 2002
The following discussion and analysis provides a comparison of our
results of operations for 2003 and 2002. This discussion should be
read in conjunction with the Consolidated Financial Statements and
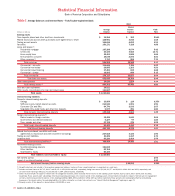
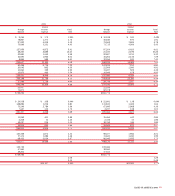
related Notes on pages 96 through 150. In addition, Tables 1 and 2
contain financial data to supplement this discussion.
Overview
Net Income
Net Income totaled $10.8 billion, or $3.57 per diluted common
share, in 2003 compared to $9.2 billion, or $2.95 per diluted com-
mon share, in 2002. The return on average common shareholders’
equity was 21.99 percent in 2003 compared to 19.44 percent in
2002. These earnings provided sufficient cash flow to allow us to
return $9.8 billion and $8.5 billion in 2003 and 2002, respectively,
in capital to shareholders in the form of dividends and share
repurchases, net of employee stock options exercised.
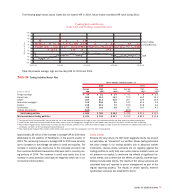
Net Interest Income
Net Interest Income on a FTE basis increased $596 million to $22.1
billion in 2003. This increase was driven by higher ALM portfolio lev-
els (consisting of securities, whole loan mortgages and derivatives),
higher consumer loan levels, larger trading-related contributions,
higher mortgage warehouse and higher core deposit funding levels.
Partially offsetting these increases was the impact of lower interest
rates and reductions in the large corporate, foreign and exited con-
sumer loan businesses portfolios. The net interest yield on a FTE
basis declined 37 bps to 3.40 percent in 2003 due to the negative
impact of increases in lower-yielding trading-related assets and declin-
ing rates offset partially by our ALM portfolio repositioning.
Noninterest Income
Noninterest Income increased $2.9 billion to $16.5 billion in 2003,
due to increases in Mortgage Banking Income of $1.2 billion, Equity
Investment Gains of $495 million, Other Noninterest Income of $484
million, Card Income of $432 million, and Service Charges of $342
million. The increase in Mortgage Banking Income was driven by
gains from higher volumes of mortgage loans sold into the secondary
market and improved profit margins. Other Noninterest Income of
$1.1 billion included gains of $772 million, an increase of $272 million
over 2002, as we sold whole loan mortgages to manage prepayment
risk due to the longer than anticipated low interest rate environment.
Additionally, Other Noninterest Income included the equity in the
earnings of our investment in GFSS of $122 million.