Bank of America 2004 Annual Report Download - page 38
Download and view the complete annual report
Please find page 38 of the 2004 Bank of America annual report below. You can navigate through the pages in the report by either clicking on the pages listed below, or by using the keyword search tool below to find specific information within the annual report.-
 1
1 -
2
-
3
-
4
-
5
-
6
-
7
-
8
-
9
-
10
-
11
-
12
-
13
-
14
-
15
-
16
-
17
-
18
-
19
-
20
-
21
-
22
-
23
-
24
-
25
-
26
-
27
-
 28
28 -
 29
29 -
 30
30 -
 31
31 -
 32
32 -
 33
33 -
 34
34 -
 35
35 -
 36
36 -
 37
37 -
 38
38 -
 39
39 -
 40
40 -
 41
41 -
 42
42 -
 43
43 -
 44
44 -
 45
45 -
 46
46 -
 47
47 -
 48
48 -
49
-
50
-
51
-
52
-
53
-
54
-
55
-
56
-
57
-
58
-
59
-
60
-
61
-
62
-
63
-
64
-
65
-
66
-
67
-
68
-
69
-
70
-
71
-
72
-
73
-
74
-
75
-
76
-
77
-
78
-
79
-
80
-
81
-
82
-
83
-
84
-
85
-
86
-
87
-
88
-
89
-
90
-
91
-
92
-
93
-
94
-
95
-
96
-
97
-
98
-
99
-
100
-
101
-
102
-
103
-
104
-
105
-
106
-
107
-
108
-
109
-
110
-
111
-
112
-
113
-
114
-
115
-
116
-
117
-
118
-
119
-
120
-
121
-
122
-
123
-
124
-
125
-
126
-
127
-
128
-
129
-
130
-
131
-
132
-
133
-
134
-
135
-
136
-
137
-
138
-
139
-
140
-
141
-
142
-
143
-
144
-
145
-
146
-
147
-
148
-
149
-
150
-
151
-
152
-
153
-
154
 |
 |

BANK OF AMERICA 2004 37
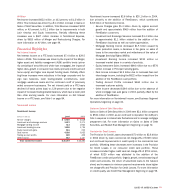
In connection with the Merger, we implemented a plan to integrate
our operations with FleetBoston’s. During 2004, including an infra-
structure initiative, $618 million was recorded as Merger and
Restructuring Charges and $658 million was recorded as an adjust-
ment to Goodwill related to these activities. During 2004, our inte-
gration activities progressed according to schedule. We rebranded all
banking centers in the former FleetBoston franchise, as well as a
majority of outstanding credit cards. In addition, we began to rollout
customer service platforms, including Premier Banking, to the
Northeast. We also completed several key systems conversions
necessary for full integration. For more information on the Merger,
see Note 2 of the Consolidated Financial Statements.
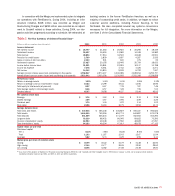
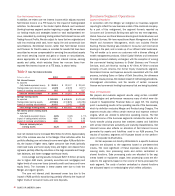
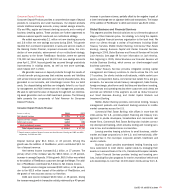
Table 1
Five-Year Summary of Selected Financial Data(1)
(Dollars in millions, except per share information) 2004 2003 2002 2001 2000
Income statement
Net interest income $ 28,797 $ 21,464 $ 20,923 $ 20,290 $ 18,349
Noninterest income 20,097 16,450 13,580 14,348 14,582
Total revenue 48,894 37,914 34,503 34,638 32,931
Provision for credit losses 2,769 2,839 3,697 4,287 2,535
Gains on sales of debt securities 2,123 941 630 475 25
Noninterest expense 27,027 20,155 18,445 20,709 18,633
Income before income taxes 21,221 15,861 12,991 10,117 11,788
Income tax expense 7,078 5,051 3,742 3,325 4,271
Net income 14,143 10,810 9,249 6,792 7,517
Average common shares issued and outstanding (in thousands) 3,758,507 2,973,407 3,040,085 3,189,914 3,292,797
Average diluted common shares issued and outstanding (in thousands) 3,823,943 3,030,356 3,130,935 3,251,308 3,329,858
Performance ratios
Return on average assets 1.35% 1.44% 1.41% 1.05% 1.12%
Return on average common shareholders’ equity 16.83 21.99 19.44 13.96 15.96
Total equity to total assets (at year end) 8.97 6.67 7.78 7.87 7.45
Total average equity to total average assets 8.06 6.57 7.28 7.55 7.03
Dividend payout 45.67 39.58 40.07 53.44 45.02
Per common share data
Earnings $ 3.76 $ 3.63 $ 3.04 $ 2.13 $ 2.28
Diluted earnings 3.69 3.57 2.95 2.09 2.26
Dividends paid 1.70 1.44 1.22 1.14 1.03
Book value 24.56 16.63 16.75 15.54 14.74
Average balance sheet
Total loans and leases $ 472,645 $ 356,148 $ 336,819 $ 365,447 $ 392,622
Total assets 1,044,660 749,056 653,774 644,887 670,078
Total deposits 551,559 406,233 371,479 362,653 353,294
Long-term debt 93,330 68,432 66,045 69,622 70,293
Common shareholders’ equity 83,953 49,148 47,552 48,609 47,057
Total shareholders’ equity 84,183 49,204 47,613 48,678 47,132
Capital ratios (at year end)
Risk-based capital:
Tier 1 8.10% 7.85% 8.22% 8.30% 7.50%
Total 11.63 11.87 12.43 12.67 11.04
Leverage 5.82 5.73 6.29 6.55 6.11
Market price per share of common stock
Closing $ 46.99 $ 40.22 $ 34.79 $ 31.48 $ 22.94
High closing 47.44 41.77 38.45 32.50 29.63
Low closing 38.96 32.82 27.08 23.38 19.00
(1) As a result of the adoption of Statement of Financial Accounting Standards (SFAS) No. 142 “Goodwill and Other Intangible Assets” (SFAS 142) on January 1, 2002, we no longer amortize Goodwill.
Goodwill amortization expense was $662 and $635 in 2001 and 2000, respectively.