Bank of America 2004 Annual Report Download - page 4
Download and view the complete annual report
Please find page 4 of the 2004 Bank of America annual report below. You can navigate through the pages in the report by either clicking on the pages listed below, or by using the keyword search tool below to find specific information within the annual report.-
 1
1 -
 2
2 -
 3
3 -
 4
4 -
 5
5 -
 6
6 -
 7
7 -
 8
8 -
 9
9 -
 10
10 -
 11
11 -
 12
12 -
 13
13 -
 14
14 -
 15
15 -
16
-
17
-
18
-
19
-
20
-
21
-
22
-
23
-
24
-
25
-
26
-
27
-
28
-
29
-
30
-
31
-
32
-
33
-
34
-
35
-
36
-
37
-
38
-
39
-
40
-
41
-
42
-
43
-
44
-
45
-
46
-
47
-
48
-
49
-
50
-
51
-
52
-
53
-
54
-
55
-
56
-
57
-
58
-
59
-
60
-
61
-
62
-
63
-
64
-
65
-
66
-
67
-
68
-
69
-
70
-
71
-
72
-
73
-
74
-
75
-
76
-
77
-
78
-
79
-
80
-
81
-
82
-
83
-
84
-
85
-
86
-
87
-
88
-
89
-
90
-
91
-
92
-
93
-
94
-
95
-
96
-
97
-
98
-
99
-
100
-
101
-
102
-
103
-
104
-
105
-
106
-
107
-
108
-
109
-
110
-
111
-
112
-
113
-
114
-
115
-
116
-
117
-
118
-
119
-
120
-
121
-
122
-
123
-
124
-
125
-
126
-
127
-
128
-
129
-
130
-
131
-
132
-
133
-
134
-
135
-
136
-
137
-
138
-
139
-
140
-
141
-
142
-
143
-
144
-
145
-
146
-
147
-
148
-
149
-
150
-
151
-
152
-
153
-
154
 |
 |

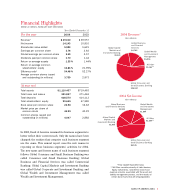
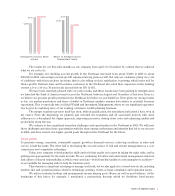
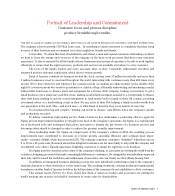
Global Wealth
and Investment
Management
$
5,918
Global Consumer and
Small Business Banking
$26,857
Global Business
and Financial
Services
$6,722
All Other
$1,064**
Global Capital
Markets and
Investment Banking
$9,049
Global Wealth
and Investment
Management
$1,584
Global Consumer and
Small Business Banking
$6,548
Global Business
and Financial Services
$2,833
All Other
$1,228**
Global Capital
Markets and
Investment Banking
$1,950
Financial Highlights
Revenue*$ 49,610 $ 38,557
Net income 14,143 10,810
Shareholder value added 5,983 5,621
Earnings per common share 3.76 3.63
Diluted earnings per common share 3.69 3.57
Dividends paid per common share 1.70 1.44
Return on average assets 1.35 % 1.44%
Return on average common
shareholders’ equity 16.83 % 21.99%
Efficiency ratio*54.48 % 52.27%
Average common shares issued
and outstanding (in millions) 3,759 2,973
Year Ended December 31
For the year 2004 2003
Total assets $1,110,457 $719,483
Total loans and leases 521,837 371,463
Total deposits 618,570 414,113
Total shareholders’ equity 99,645 47,980
Book value per common share 24.56 16.63
Market price per share of
common stock 46.99 40.22
Common shares issued and
outstanding (in millions) 4,047 2,882
At year end
2004 Revenue*
($ in millions)
2004 Net Income
($ in millions)
BANK OF AMERICA 2004 3
*Fully taxable-equivalent basis
**All Other consists primarily of Latin America,
Equity Investments, noninterest income and
expense amounts associated with the asset and
liability management process, and the results of
certain businesses that are being liquidated.
(Dollars in millions, except per share information)
In 2005, Bank of America renamed its business segments to
better reflect their current reach. Only the names have been
changed; the entities that comprise each business segment
are the same. This annual report uses the new names in
reporting on these business segments’ activities for 2004.
The new name and former name of each business segment
follows: Global Consumer and Small Business Banking was
called Consumer and Small Business Banking; Global
Business and Financial Services was called Commercial
Banking; Global Capital Markets and Investment Banking
was called Global Corporate and Investment Banking; and
Global Wealth and Investment Management was called
Wealth and Investment Management.