Bank of America 2004 Annual Report Download - page 36
Download and view the complete annual report
Please find page 36 of the 2004 Bank of America annual report below. You can navigate through the pages in the report by either clicking on the pages listed below, or by using the keyword search tool below to find specific information within the annual report.-
 1
1 -
2
-
3
-
4
-
5
-
6
-
7
-
8
-
9
-
10
-
11
-
12
-
13
-
14
-
15
-
16
-
17
-
18
-
19
-
20
-
21
-
22
-
23
-
24
-
25
-
 26
26 -
 27
27 -
 28
28 -
 29
29 -
 30
30 -
 31
31 -
 32
32 -
 33
33 -
 34
34 -
 35
35 -
 36
36 -
 37
37 -
 38
38 -
 39
39 -
 40
40 -
 41
41 -
 42
42 -
 43
43 -
 44
44 -
 45
45 -
 46
46 -
47
-
48
-
49
-
50
-
51
-
52
-
53
-
54
-
55
-
56
-
57
-
58
-
59
-
60
-
61
-
62
-
63
-
64
-
65
-
66
-
67
-
68
-
69
-
70
-
71
-
72
-
73
-
74
-
75
-
76
-
77
-
78
-
79
-
80
-
81
-
82
-
83
-
84
-
85
-
86
-
87
-
88
-
89
-
90
-
91
-
92
-
93
-
94
-
95
-
96
-
97
-
98
-
99
-
100
-
101
-
102
-
103
-
104
-
105
-
106
-
107
-
108
-
109
-
110
-
111
-
112
-
113
-
114
-
115
-
116
-
117
-
118
-
119
-
120
-
121
-
122
-
123
-
124
-
125
-
126
-
127
-
128
-
129
-
130
-
131
-
132
-
133
-
134
-
135
-
136
-
137
-
138
-
139
-
140
-
141
-
142
-
143
-
144
-
145
-
146
-
147
-
148
-
149
-
150
-
151
-
152
-
153
-
154
 |
 |

BANK OF AMERICA 2004 35
All Other
Net Income increased $623 million, or 103 percent, to $1.2 billion in
2004. This increase was driven by a $1.1 billion increase in Gains on
Sales of Debt Securities. In addition, Total Revenue increased $318
million, or 43 percent, to $1.1 billion due to improvements in both
Latin America and Equity Investments. Partially offsetting these
increases was a $607 million increase in Noninterest Expense,
driven by $618 million of Merger and Restructuring Charges. For
more information on All Other, see page 49.
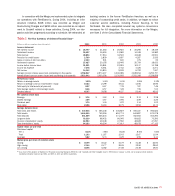
Financial Highlights
Net Interest Income
Net Interest Income on a FTE basis increased $7.4 billion to $29.5
billion in 2004. This increase was driven by the impact of the Merger,
higher asset and liability management (ALM) portfolio levels (prima-
rily consisting of securities and whole loan mortgages), the impact of
higher rates, growth in consumer loan levels (primarily credit card and
home equity) and higher core deposit funding levels. Partially offset-
ting these increases were reductions in the large corporate and for-
eign loan balances, lower trading-related contributions, lower
mortgage warehouse levels and the continued runoff of previously
exited consumer businesses. The net interest yield on a FTE basis
declined 14 basis points (bps) to 3.26 percent due to the negative
impact of increased trading-related balances, which have a lower yield
than other earning assets. For more information on Net Interest
Income on a FTE basis, see Table
I
on page 84.
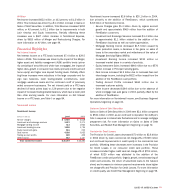
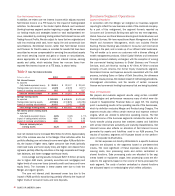
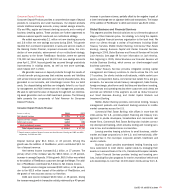
Noninterest Income
Noninterest Income
(Dollars in millions) 2004 2003
Service charges $ 6,989 $ 5,618
Investment and brokerage services 3,627 2,371
Mortgage banking income 414 1,922
Investment banking income 1,886 1,736
Equity investment gains 861 215
Card income 4,588 3,052
Trading account profits 869 409
Other income 863 1,127
Total noninterest income $ 20,097 $16,450
Noninterest Income increased $3.6 billion to $20.1 billion in 2004,
due primarily to the addition of FleetBoston, which contributed
$3.8 billion of Noninterest Income.
•Service Charges grew $1.4 billion driven by organic account
growth and approximately $960 million from the addition of
FleetBoston customers.
•Investment and Brokerage Services increased $1.3 billion due
to approximately $1.1 billion related to the addition of the
FleetBoston business as well as market appreciation.
•Mortgage Banking Income decreased $1.5 billion caused by
lower production levels, a decrease in the gains on sales of
loans to the secondary market and writedowns of the value of
Mortgage Servicing Rights (MSRs).
•Investment Banking Income increased $150 million on
increased market share in a variety of products.
•Equity Investment Gains increased $646 million due to a $576
million increase in Principal Investing gains.
•Card Income increased $1.5 billion due to increased fees and
interchange income, including the $832 million impact from the
addition of the FleetBoston card portfolio.
•Trading Account Profits increased $460 million due to
increased customer activity.
•Other Income decreased $264 million due to the absence of
whole mortgage loan sale gains in 2004, partially offset by the
addition of FleetBoston.
For more information on Noninterest Income, see Business Segment
Operations beginning on page 40.
Gains on Sales of Debt Securities
Gains on Sales of Debt Securities in 2004 were $2.1 billion compared
to $941 million in 2003, as we continued to reposition the ALM port-
folio in response to interest rate fluctuations and to manage mortgage
prepayment risk. For more information on Gains on Sales of Debt
Securities, see Market Risk Management beginning on page 72.
Provision for Credit Losses
The Provision for Credit Losses decreased $70 million to $2.8 billion
in 2004 driven by lower commercial net charge-offs of $748 million
and continued improvements in credit quality in the commercial loan
portfolio. Offsetting these decreases were increases in the Provision
for Credit Losses in our consumer credit card portfolio. These
increases included higher credit card net charge-offs of $791 million,
of which $320 million was attributed to the addition of the
FleetBoston credit card portfolio. Organic growth, overall seasoning of
credit card accounts, the return of securitized loans to the balance
sheet, and increases in minimum payment requirements drove higher
net charge-offs and Provision for Credit Losses. For more information
on credit quality, see Credit Risk Management beginning on page 58.