Bank of America 2004 Annual Report Download - page 120
Download and view the complete annual report
Please find page 120 of the 2004 Bank of America annual report below. You can navigate through the pages in the report by either clicking on the pages listed below, or by using the keyword search tool below to find specific information within the annual report.-
 1
1 -
2
-
3
-
4
-
5
-
6
-
7
-
8
-
9
-
10
-
11
-
12
-
13
-
14
-
15
-
16
-
17
-
18
-
19
-
20
-
21
-
22
-
23
-
24
-
25
-
26
-
27
-
28
-
29
-
30
-
31
-
32
-
33
-
34
-
35
-
36
-
37
-
38
-
39
-
40
-
41
-
42
-
43
-
44
-
45
-
46
-
47
-
48
-
49
-
50
-
51
-
52
-
53
-
54
-
55
-
56
-
57
-
58
-
59
-
60
-
61
-
62
-
63
-
64
-
65
-
66
-
67
-
68
-
69
-
70
-
71
-
72
-
73
-
74
-
75
-
76
-
77
-
78
-
79
-
80
-
81
-
82
-
83
-
84
-
85
-
86
-
87
-
88
-
89
-
90
-
91
-
92
-
93
-
94
-
95
-
96
-
97
-
98
-
99
-
100
-
101
-
102
-
103
-
104
-
105
-
106
-
107
-
108
-
109
-
 110
110 -
 111
111 -
 112
112 -
 113
113 -
 114
114 -
 115
115 -
 116
116 -
 117
117 -
 118
118 -
 119
119 -
 120
120 -
 121
121 -
 122
122 -
 123
123 -
 124
124 -
 125
125 -
 126
126 -
 127
127 -
 128
128 -
 129
129 -
 130
130 -
131
-
132
-
133
-
134
-
135
-
136
-
137
-
138
-
139
-
140
-
141
-
142
-
143
-
144
-
145
-
146
-
147
-
148
-
149
-
150
-
151
-
152
-
153
-
154
 |
 |

BANK OF AMERICA 2004 119
December 31, 2004 December 31, 2003
Principal Principal
Total Amount of Principal Total Amount of Principal
Principal Accruing Loans Amount of Principal Accruing Loans Amount of
Amount of and Leases Nonperforming Amount of and Leases Nonperforming
Loans and Past Due 90 Loans and Loans and Past Due 90 Loans and
(Dollars in millions) Leases Days or More(1) Leases Leases Days or More(1) Leases
Residential mortgage $ 178,103 $ – $ 554 $140,513 $ – $ 531
Credit card 58,629 1,223 – 36,596 647 –
Home equity lines 50,756 3 66 23,859 – 43
Direct/Indirect consumer 40,513 58 33 33,415 47 28
Other consumer 7,439 23 85 7,558 35 36
Total consumer 335,440 1,307 738 241,941 729 638
Commercial – domestic 125,432 121 855 91,491 108 1,388
Commercial real estate 32,319 1 87 19,367 23 141
Commercial lease financing 21,115 14 266 9,692 2 127
Commercial – foreign 18,401 2 267 10,754 29 578
Total commercial 197,267 138 1,475 131,304 162 2,234
Total managed loans and leases 532,707 $ 1,445 $ 2,213 373,245 $ 891 $ 2,872
Loans in revolving securitizations (10,870) (1,782)
Total held loans and leases $ 521,837 $371,463
Year Ended December 31, 2004 Year Ended December 31, 2003
Average Average
Loans and Loans and Loans and Loans and
Leases Leases Net Net Loss Leases Leases Net Net Loss
(Dollars in millions) Outstanding Losses Ratio(2) Outstanding Losses Ratio(2)
Residential mortgage $ 167,298 $ 36 0.02% $127,059 $ 40 0.03%
Credit card 50,296 2,829 5.62 31,552 1,691 5.36
Home equity lines 39,942 15 0.04 22,890 11 0.05
Direct/Indirect consumer 38,078 208 0.55 32,593 181 0.55
Other consumer 7,717 193 2.50 8,865 256 2.89
Total consumer 303,331 3,281 1.08 222,959 2,179 0.98
Commercial – domestic 117,422 184 0.16 93,458 633 0.68
Commercial real estate 28,085 (3) (0.01) 20,042 41 0.20
Commercial lease financing 17,483 9 0.05 10,061 124 1.23
Commercial – foreign 16,505 173 1.05 12,970 306 2.36
Total commercial 179,495 363 0.20 136,531 1,104 0.81
Total managed loans and leases 482,826 $ 3,644 0.75% 359,490 $3,283 0.91%
Loans in revolving securitizations (10,181) (3,342)
Total held loans and leases $ 472,645 $356,148
(1) Excludes consumer real estate loans, which are placed on nonperforming status at 90 days past due.
(2) The net loss ratio is calculated by dividing managed loans and leases net losses by average managed loans and leases outstanding for each loan and lease category.
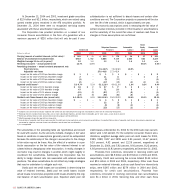
received on retained interests, such as cash flows from interest-only
strips, were $4 million and $11 million, respectively, in 2004 for
commercial loan securitizations.
The Corporation reviews its loans and leases portfolio on a man-
aged basis. Managed loans and leases are defined as on-balance
sheet Loans and Leases as well as loans in revolving securitizations,
which include credit cards, home equity lines and commercial loans.
New advances under previously securitized accounts will be recorded
on the Corporation’s Consolidated Balance Sheet after the revolving
period of the securitization, which has the effect of increasing Loans
and Leases on the Corporation’s Consolidated Balance Sheet and
increasing Net Interest Income and charge-offs, with a corresponding
reduction in Noninterest Income. Portfolio balances, delinquency and
historical loss amounts of the managed loans and leases portfolio
for 2004 and 2003 were as follows:
Variable Interest Entities
At December 31, 2004, the assets and liabilities of ABCP conduits
that have been consolidated in accordance with FIN 46 were reflected
in AFS Securities, Other Assets, and Commercial Paper and Other
Short-term Borrowings in the Global Capital Markets and Investment
Banking business segment. As of December 31, 2004 and 2003, the
Corporation held $7.7 billion and $5.6 billion of assets in these enti-
ties, respectively, while the Corporation’s maximum loss exposure
associated with these entities including unfunded lending commit-
ments was approximately $9.4 billion and $7.6 billion, respectively.
The Corporation also had contractual relationships with other con-