Bank of America 2004 Annual Report Download - page 139
Download and view the complete annual report
Please find page 139 of the 2004 Bank of America annual report below. You can navigate through the pages in the report by either clicking on the pages listed below, or by using the keyword search tool below to find specific information within the annual report.-
 1
1 -
2
-
3
-
4
-
5
-
6
-
7
-
8
-
9
-
10
-
11
-
12
-
13
-
14
-
15
-
16
-
17
-
18
-
19
-
20
-
21
-
22
-
23
-
24
-
25
-
26
-
27
-
28
-
29
-
30
-
31
-
32
-
33
-
34
-
35
-
36
-
37
-
38
-
39
-
40
-
41
-
42
-
43
-
44
-
45
-
46
-
47
-
48
-
49
-
50
-
51
-
52
-
53
-
54
-
55
-
56
-
57
-
58
-
59
-
60
-
61
-
62
-
63
-
64
-
65
-
66
-
67
-
68
-
69
-
70
-
71
-
72
-
73
-
74
-
75
-
76
-
77
-
78
-
79
-
80
-
81
-
82
-
83
-
84
-
85
-
86
-
87
-
88
-
89
-
90
-
91
-
92
-
93
-
94
-
95
-
96
-
97
-
98
-
99
-
100
-
101
-
102
-
103
-
104
-
105
-
106
-
107
-
108
-
109
-
110
-
111
-
112
-
113
-
114
-
115
-
116
-
117
-
118
-
119
-
120
-
121
-
122
-
123
-
124
-
125
-
126
-
127
-
128
-
 129
129 -
 130
130 -
 131
131 -
 132
132 -
 133
133 -
 134
134 -
 135
135 -
 136
136 -
 137
137 -
 138
138 -
 139
139 -
 140
140 -
 141
141 -
 142
142 -
 143
143 -
 144
144 -
 145
145 -
 146
146 -
 147
147 -
 148
148 -
 149
149 -
150
-
151
-
152
-
153
-
154
 |
 |

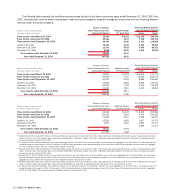
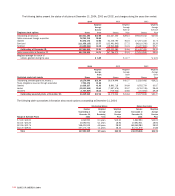
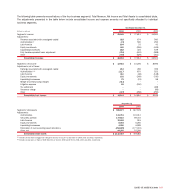
Amounts recognized in the Consolidated Financial Statements at December 31, 2004 and 2003 are as follows:
Qualified Nonqualified Postretirement
Pension Plans Pension Plans Health and Life Plans
(Dollars in millions) 2004 2003 2004 2003 2004 2003
Prepaid benefit cost $ 3,384 $3,064 $– $– $– $–
Accrued benefit cost ––(918) (499) (822) (535)
Additional minimum liability ––(161) (129) ––
Intangible asset ––118 ––
Accumulated other comprehensive income ––160 111 ––
Net amount recognized at December 31 $ 3,384 $3,064 $ (918) $ (499) $ (822) $ (535)
Net periodic pension benefit cost for 2004, 2003 and 2002 included the following components:
Qualified Pension Plans Nonqualified Pension Plans
(Dollars in millions) 2004 2003 2002 2004 2003 2002
Components of net periodic pension benefit cost
Service cost $ 257 $ 187 $ 199 $27 $ 25 $ 27
Interest cost 623 514 540 62 45 44
Expected return on plan assets (915) (735) (746) –––
Amortization of transition asset ––– –––
Amortization of prior service cost 55 55 55 3310
Recognized net actuarial loss 92 47 – 14 11 11
Recognized loss due to settlements and curtailments ––– ––26
Net periodic pension benefit cost $ 112 $ 68 $ 48 $ 106 $ 84 $118
Weighted average assumptions used to
determine net cost for years ended December 31
Discount rate(1) 6.25% 6.75% 7.25% 6.25% 6.75% 7.25%
Expected return on plan assets 8.50 8.50 8.50 n/a n/a n/a
Rate of compensation increase 4.00 4.00 4.00 4.00 4.00 4.00
(1) In connection with the Merger, the plans of former FleetBoston were remeasured on April 1, 2004, using a discount rate of 6 percent.
n/a = not applicable
138 BANK OF AMERICA 2004
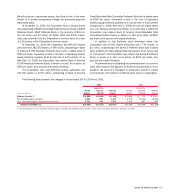
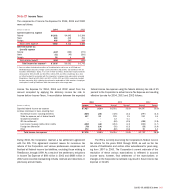
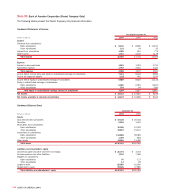
For 2004, 2003 and 2002, net periodic postretirement benefit cost
included the following components:
(Dollars in millions) 2004(1) 2003 2002
Components of net periodic
postretirement benefit cost
Service cost $9 $9 $11
Interest cost 76 68 67
Expected return on plan assets (16) (15) (17)
Amortization of transition obligation 32 32 32
Amortization of prior service cost 146
Recognized net actuarial loss 74 89 40
Net periodic
postretirement benefit cost $176 $187 $139
Weighted average assumptions
used to determine net cost for
years ended December 31
Discount rate(2) 6.25% 6.75% 7.25%
Expected return on plan assets 8.50 8.50 8.50
(1) Includes the effect of the adoption of FSP No. 106-2, which reduced net periodic postretirement
benefit cost by $15.
(2) In connection with the Merger, the plans of former FleetBoston were remeasured on April 1,
2004, using a discount rate of 6 percent.
Net periodic postretirement health and life expense was determined
using the “projected unit credit” actuarial method. Gains and losses
for all benefits except postretirement health care are recognized in
accordance with the standard amortization provisions of the applica-
ble accounting standards. For the Postretirement Health Care Plans,
50 percent of the unrecognized gain or loss at the beginning of the
fiscal year (or at subsequent remeasurement) is recognized on a level
basis during the year.
Assumed health care cost trend rates affect the postretirement
benefit obligation and benefit cost reported for the Postretirement
Health Care Plans. The assumed health care cost trend rate used to
measure the expected cost of benefits covered by the Postretirement
Health Care Plans was 10 percent for 2005, reducing in steps to 5
percent in 2008 and later years. A one-percentage-point increase in
assumed health care cost trend rates would have increased the serv-
ice and interest costs and the benefit obligation by $4 million and