Bank of America 2004 Annual Report Download - page 63
Download and view the complete annual report
Please find page 63 of the 2004 Bank of America annual report below. You can navigate through the pages in the report by either clicking on the pages listed below, or by using the keyword search tool below to find specific information within the annual report.-
 1
1 -
2
-
3
-
4
-
5
-
6
-
7
-
8
-
9
-
10
-
11
-
12
-
13
-
14
-
15
-
16
-
17
-
18
-
19
-
20
-
21
-
22
-
23
-
24
-
25
-
26
-
27
-
28
-
29
-
30
-
31
-
32
-
33
-
34
-
35
-
36
-
37
-
38
-
39
-
40
-
41
-
42
-
43
-
44
-
45
-
46
-
47
-
48
-
49
-
50
-
51
-
52
-
 53
53 -
 54
54 -
 55
55 -
 56
56 -
 57
57 -
 58
58 -
 59
59 -
 60
60 -
 61
61 -
 62
62 -
 63
63 -
 64
64 -
 65
65 -
 66
66 -
 67
67 -
 68
68 -
 69
69 -
 70
70 -
 71
71 -
 72
72 -
 73
73 -
74
-
75
-
76
-
77
-
78
-
79
-
80
-
81
-
82
-
83
-
84
-
85
-
86
-
87
-
88
-
89
-
90
-
91
-
92
-
93
-
94
-
95
-
96
-
97
-
98
-
99
-
100
-
101
-
102
-
103
-
104
-
105
-
106
-
107
-
108
-
109
-
110
-
111
-
112
-
113
-
114
-
115
-
116
-
117
-
118
-
119
-
120
-
121
-
122
-
123
-
124
-
125
-
126
-
127
-
128
-
129
-
130
-
131
-
132
-
133
-
134
-
135
-
136
-
137
-
138
-
139
-
140
-
141
-
142
-
143
-
144
-
145
-
146
-
147
-
148
-
149
-
150
-
151
-
152
-
153
-
154
 |
 |

62 BANK OF AMERICA 2004
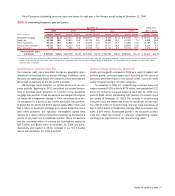
Concentrations of Commercial Credit Risk
Portfolio credit risk is evaluated and managed with a goal that
concentrations of credit exposure do not result in undesirable levels
of risk. We review, measure, and manage concentrations of credit
exposure by industry, product, geography and customer relationship.
Distribution of Loans and Leases by loan size is an additional meas-
ure of the portfolio risk diversification. We also review, measure, and
manage commercial real estate loans by geographic location and prop-
erty type. In addition, within our international portfolio, we evaluate
borrowings by region and by country. Tables 14 through 19 summarize
these concentrations. These activities play an important role in man-
aging credit risk concentrations and for other risk mitigation purposes.
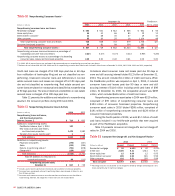
From the perspective of portfolio risk management, customer
concentration management is most relevant in Global Capital Markets
and Investment Banking. Within Global Capital Markets and
Investment Banking, concentrations continue to be addressed
through the underwriting and ongoing monitoring processes, the
established strategy of “originate to distribute” and partly through
the purchase of credit protection through credit derivatives. We utilize
various risk mitigation tools to economically hedge our risk to certain
credit counterparties. Credit derivatives are financial instruments
that we purchase for protection against the deterioration of credit
quality. At December 31, 2004, we had $13.1 billion of credit pro-
tection. The total cost of the premium of the credit derivatives port-
folio was $84 million and $68 million for 2004 and 2003,
respectively. Two widely used tools are credit default swaps and col-
lateralized loan obligations (CLOs) in which a layer of loss is sold to
third parties. Earnings volatility increases due to accounting asym-
metry as we mark to market the credit default swaps, as required by
SFAS 133, and CLOs through Trading Account Profits, while the loans
are recorded at historical cost less allowance for credit losses or, if
held-for-sale, the lower of cost or market. The cost of credit portfolio
hedges including the negative mark-to-market was $144 million and
$330 million for 2004 and 2003, respectively.
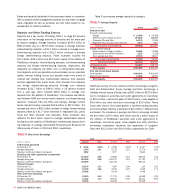
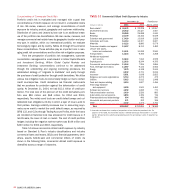
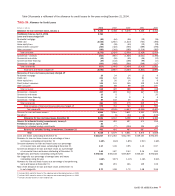
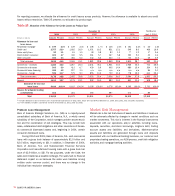
Table 14 shows commercial utilized credit exposure by industry
based on Standard & Poor’s industry classifications and includes
commercial loans and leases, SBLCs and financial guarantees, deriv-
atives, assets held-for-sale and commercial letters of credit. As
shown in the following table, commercial utilized credit exposure is
diversified across a range of industries.
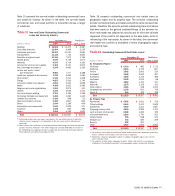
Table 14
Commercial Utilized Credit Exposure by Industry
December 31 FleetBoston
(Dollars in millions) 2004 2003 April 1, 2004
■■■■■
Real estate(1) $ 36,672 $ 22,228 $ 12,957
Diversified financials 25,932 20,427 3,557
Banks 25,265 25,088 1,040
Retailing 23,149 15,152 6,539
Education and government 17,429 13,919 1,629
Individuals and trusts 16,110 14,307 2,627
Materials 14,123 8,860 5,079
Consumer durables and apparel 13,427 8,313 3,482
Leisure and sports,
hotels and restaurants 13,331 10,099 2,940
Transportation 13,234 9,355 3,268
Healthcare equipment
and services 12,643 7,064 4,939
Capital goods 12,633 8,244 4,355
Commercial services and supplies 11,944 7,206 3,866
Food, beverage and tobacco 11,687 9,134 2,552
Energy 7,579 4,348 2,044
Media 6,232 4,701 2,616
Insurance 5,851 3,638 2,822
Religious and social organizations 5,710 4,272 475
Utilities 5,615 5,012 1,948
Food and staples retailing 3,610 1,837 1,456
Technology hardware
and equipment 3,398 1,941 1,463
Software and services 3,292 1,655 770
Telecommunication services 3,030 2,526 883
Automobiles and components 1,894 1,326 746
Pharmaceuticals and biotechnology 994 466 590
Household and personal products 371 302 195
Other 3,132 1,474 3,751
■■■■■
Total $298,287 $212,894 $ 78,589
■■■■■
(1) Industries are viewed from a variety of perspectives to best isolate the perceived risks. For
purposes of this table, the real estate industry is defined based upon the borrowers’ or counter-
parties’ primary business activity using operating cash flow and primary source of repayment as
key factors.