Bank of America 2004 Annual Report Download - page 59
Download and view the complete annual report
Please find page 59 of the 2004 Bank of America annual report below. You can navigate through the pages in the report by either clicking on the pages listed below, or by using the keyword search tool below to find specific information within the annual report.-
 1
1 -
2
-
3
-
4
-
5
-
6
-
7
-
8
-
9
-
10
-
11
-
12
-
13
-
14
-
15
-
16
-
17
-
18
-
19
-
20
-
21
-
22
-
23
-
24
-
25
-
26
-
27
-
28
-
29
-
30
-
31
-
32
-
33
-
34
-
35
-
36
-
37
-
38
-
39
-
40
-
41
-
42
-
43
-
44
-
45
-
46
-
47
-
48
-
 49
49 -
 50
50 -
 51
51 -
 52
52 -
 53
53 -
 54
54 -
 55
55 -
 56
56 -
 57
57 -
 58
58 -
 59
59 -
 60
60 -
 61
61 -
 62
62 -
 63
63 -
 64
64 -
 65
65 -
 66
66 -
 67
67 -
 68
68 -
 69
69 -
70
-
71
-
72
-
73
-
74
-
75
-
76
-
77
-
78
-
79
-
80
-
81
-
82
-
83
-
84
-
85
-
86
-
87
-
88
-
89
-
90
-
91
-
92
-
93
-
94
-
95
-
96
-
97
-
98
-
99
-
100
-
101
-
102
-
103
-
104
-
105
-
106
-
107
-
108
-
109
-
110
-
111
-
112
-
113
-
114
-
115
-
116
-
117
-
118
-
119
-
120
-
121
-
122
-
123
-
124
-
125
-
126
-
127
-
128
-
129
-
130
-
131
-
132
-
133
-
134
-
135
-
136
-
137
-
138
-
139
-
140
-
141
-
142
-
143
-
144
-
145
-
146
-
147
-
148
-
149
-
150
-
151
-
152
-
153
-
154
 |
 |

58 BANK OF AMERICA 2004
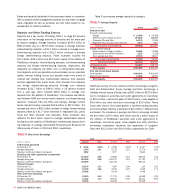
Capital Management
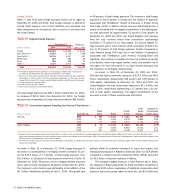
The final component of liquidity risk is capital management, which
focuses on the level of Shareholders’ Equity. Shareholders’ Equity
was $99.6 billion at December 31, 2004, an increase of $51.7 billion
from December 31, 2003. This increase was driven by stock issued
for the acquisition of FleetBoston of $46.8 billion, Net Income of
$14.1 billion and Common Stock Issued Under Employee Plans and
Related Tax Benefits of $3.9 billion, offset by dividends paid of $6.5
billion and common share repurchases of $6.3 billion. For additional
information on common share repurchases, see Note 13 of the
Consolidated Financial Statements. We will continue to repurchase
shares, from time to time, in the open market or in private transac-
tions through our previously approved repurchase plans.
During the second quarter of 2004, the Board approved a 2-for-1
stock split in the form of a common stock dividend and increased the
quarterly cash dividend 12.5 percent from $0.40 to $0.45 per post-
split share. The common stock dividend was effective August 27,
2004 to common shareholders of record on August 6, 2004 and the
cash dividend was effective September 24, 2004 to common share-
holders of record on September 3, 2004. All prior period common
share and related per common share information has been restated
to reflect the 2-for-1 stock split.
As part of the SVA calculation, equity is allocated to business
units based on an assessment of risk. The allocated amount of capital
varies according to the risk characteristics of the individual business
segments and the products they offer. Capital is allocated separately
based on the following types of risk: credit, market and operational.
Average common equity allocated to business units was $69.3 billion
and $31.4 billion in 2004 and 2003, respectively. The increase in aver-
age allocated common equity was primarily due to the Merger. Average
unallocated common equity (not allocated to business units) was
$14.7 billion and $17.7 billion in 2004 and 2003, respectively.
As a regulated financial services company, we are governed by
certain regulatory capital requirements. The regulatory Tier 1 Capital
ratio was 8.10 percent at December 31, 2004, an increase of 25 bps
from a year ago, reflecting higher Tier 1 Capital partially offset by
higher risk-weighted assets. The minimum Tier 1 Capital ratio
required is four percent. As of December 31, 2004, we were classified
as “well-capitalized” for regulatory purposes, the highest classifica-
tion. For additional information on the regulatory capital ratios along
with a description of the components of risk-based capital, capital
adequacy requirements and prompt corrective action provisions, see
Note 14 of the Consolidated Financial Statements.
The capital treatment of trust preferred securities (Trust
Securities) is currently under review by the FRB due to the issuing
trust companies being deconsolidated under FIN 46R. On May 6,
2004, the FRB proposed to allow Trust Securities to continue to qualify
as Tier 1 Capital with revised quantitative limits that would be effective
after a three-year transition period. As a result, we will continue to
report Trust Securities in Tier 1 Capital. In addition, the FRB is
proposing to revise the qualitative standards for capital instruments
included in regulatory capital. The proposed quantitative limits and
qualitative standards are not expected to have a material impact to
our current Trust Securities position included in regulatory capital.
On July 28, 2004, the FRB and other regulatory agencies issued
the Final Capital Rule for Consolidated Asset-backed Commercial
Paper Program Assets (the Final Rule). The Final Rule allows compa-
nies to exclude from risk-weighted assets, the assets of consolidated
ABCP conduits when calculating Tier 1 and Total Risk-based Capital
ratios. The Final Rule also requires that liquidity commitments pro-
vided by the Corporation to ABCP conduits, whether consolidated or
not, be included in the capital calculations. The Final Rule was effec-
tive September 30, 2004. There was no material impact to Tier 1 and
Risk-based Capital as a result of the adoption of this rule.
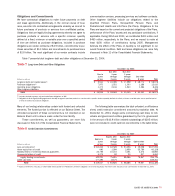
Credit Risk Management
Credit risk is the risk of loss arising from a borrower’s or counterparty’s
inability to meet its obligations. Credit risk exists in our outstanding
loans and leases, derivatives, trading account assets and unfunded
lending commitments that include loan commitments, letters of
credit and financial guarantees. We define the credit exposure to
a borrower or counterparty as the loss potential arising from all prod-
uct classifications, including loans and leases, standby letters of
credit and financial guarantees, derivative and trading account
assets, assets held-for-sale and commercial letters of credit. For deriv-
ative positions, we use the current mark-to-market value to represent
credit exposure without giving consideration to future mark-to-market
changes. Our consumer and commercial credit extension and review
procedures take into account credit exposures that are both funded
and unfunded. For additional information on derivatives and credit
extension commitments, see Notes 4 and 12 of the Consolidated
Financial Statements.
We manage credit risk based on the risk profile of the borrower
or counterparty, repayment sources, the nature of underlying collateral,
and other support given current events and conditions. We classify
our Loans and Leases as either consumer or commercial and moni-
tor their credit risk separately as discussed below.
Consumer Portfolio Credit Risk Management
Credit risk management for the consumer portfolio begins with initial
underwriting and continues throughout a borrower’s credit cycle.
Statistical techniques are used to establish product pricing, risk
appetite, operating processes and metrics to balance risks and
rewards. Consumer exposure is grouped by product and other attrib-
utes for purposes of evaluating credit risk. Statistical models are
built using detailed behavioral information from external sources
such as credit bureaus as well as internal historical experience.
These models are essential to our consumer credit risk management
process and are used, where applicable, in the determination of
credit decisions, collections management procedures, portfolio man-
agement decisions, determination of the allowance for consumer
loan and lease losses, and economic capital allocation for credit risk.