Bank of America 2004 Annual Report Download - page 87
Download and view the complete annual report
Please find page 87 of the 2004 Bank of America annual report below. You can navigate through the pages in the report by either clicking on the pages listed below, or by using the keyword search tool below to find specific information within the annual report.-
 1
1 -
2
-
3
-
4
-
5
-
6
-
7
-
8
-
9
-
10
-
11
-
12
-
13
-
14
-
15
-
16
-
17
-
18
-
19
-
20
-
21
-
22
-
23
-
24
-
25
-
26
-
27
-
28
-
29
-
30
-
31
-
32
-
33
-
34
-
35
-
36
-
37
-
38
-
39
-
40
-
41
-
42
-
43
-
44
-
45
-
46
-
47
-
48
-
49
-
50
-
51
-
52
-
53
-
54
-
55
-
56
-
57
-
58
-
59
-
60
-
61
-
62
-
63
-
64
-
65
-
66
-
67
-
68
-
69
-
70
-
71
-
72
-
73
-
74
-
75
-
76
-
 77
77 -
 78
78 -
 79
79 -
 80
80 -
 81
81 -
 82
82 -
 83
83 -
 84
84 -
 85
85 -
 86
86 -
 87
87 -
 88
88 -
 89
89 -
 90
90 -
 91
91 -
 92
92 -
 93
93 -
 94
94 -
 95
95 -
 96
96 -
 97
97 -
98
-
99
-
100
-
101
-
102
-
103
-
104
-
105
-
106
-
107
-
108
-
109
-
110
-
111
-
112
-
113
-
114
-
115
-
116
-
117
-
118
-
119
-
120
-
121
-
122
-
123
-
124
-
125
-
126
-
127
-
128
-
129
-
130
-
131
-
132
-
133
-
134
-
135
-
136
-
137
-
138
-
139
-
140
-
141
-
142
-
143
-
144
-
145
-
146
-
147
-
148
-
149
-
150
-
151
-
152
-
153
-
154
 |
 |

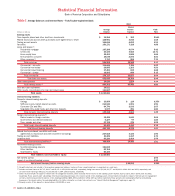
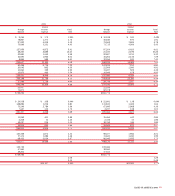
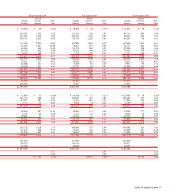
Table II
Analysis of Changes in Net Interest Income – Fully Taxable-equivalent Basis
From 2003 to 2004 From 2002 to 2003
Due to Change in(1) Net Due to Change in(1) Net
(Dollars in millions) Volume Rate Change Volume Rate Change
Increase (decrease) in interest income
Time deposits placed and other short-term investments $ 99 $ 91 $ 190 $ (24) $ (47) $ (71)
Federal funds sold and securities purchased under agreements to resell 871 (201) 670 636 (133) 503
Trading account assets 305 (218) 87 841 (642) 199
Securities 3,522 673 4,195 (169) (706) (875)
Loans and leases:
Residential mortgage 2,179 23 2,202 1,976 (1,527) 449
Credit card 1,557 210 1,767 697 (6) 691
Home equity lines 753 42 795 5 (178) (173)
Direct/Indirect consumer 332 (203) 129 166 (347) (181)
Other consumer (76) 82 6 (273) (69) (342)
Total consumer 4,899 444
Commercial – domestic 1,525 (1,128) 397 (637) 355 (282)
Commercial real estate 346 55 401 (76) (122) (198)
Commercial lease financing 290 134 424 (53) (57) (110)
Commercial – foreign 124 265 389 (159) (59) (218)
Total commercial 1,611 (808)
Total loans and leases 6,510 (364)
Other earning assets (136) 221 85 808 (636) 172
Total interest income $11,737 $ (436)
Increase (decrease) in interest expense
Domestic interest-bearing deposits:
Savings $ 41 $ (30) $ 11 $ 19 $ (49) $ (30)
NOW and money market deposit accounts 545 140 685 180 (313) (133)
Consumer CDs and IRAs 969 (1,220) (251) 116 (300) (184)
Negotiable CDs, public funds and other time deposits (28) 188 160 103 (101) 2
Total domestic interest-bearing deposits 605 (345)
Foreign interest-bearing deposits:
Banks located in foreign countries 130 507 637 (43) 4 (39)
Governments and official institutions 44 22 66 (2) (10) (12)
Time, savings and other 100 (41) 59 4 (134) (130)
Total foreign interest-bearing deposits 762 (181)
Total interest-bearing deposits 1,367 (526)
Federal funds purchased, securities sold under
agreements to repurchase and other short-term borrowings 1,156 1,407 2,563 841 (952) (111)
Trading account liabilities (64) 95 31 223 (197) 26
Long-term debt 738 (368) 370 91 (512) (421)
Total interest expense 4,331 (1,032)
Net increase in net interest income $ 7,406 $ 596
(1) The changes for each category of interest income and expense are divided between the portion of change attributable to the variance in volume or rate for that category. The unallocated change in rate or
volume variance has been allocated between the rate and volume variances.
86 BANK OF AMERICA 2004