Bank of America 2004 Annual Report Download - page 145
Download and view the complete annual report
Please find page 145 of the 2004 Bank of America annual report below. You can navigate through the pages in the report by either clicking on the pages listed below, or by using the keyword search tool below to find specific information within the annual report.-
 1
1 -
2
-
3
-
4
-
5
-
6
-
7
-
8
-
9
-
10
-
11
-
12
-
13
-
14
-
15
-
16
-
17
-
18
-
19
-
20
-
21
-
22
-
23
-
24
-
25
-
26
-
27
-
28
-
29
-
30
-
31
-
32
-
33
-
34
-
35
-
36
-
37
-
38
-
39
-
40
-
41
-
42
-
43
-
44
-
45
-
46
-
47
-
48
-
49
-
50
-
51
-
52
-
53
-
54
-
55
-
56
-
57
-
58
-
59
-
60
-
61
-
62
-
63
-
64
-
65
-
66
-
67
-
68
-
69
-
70
-
71
-
72
-
73
-
74
-
75
-
76
-
77
-
78
-
79
-
80
-
81
-
82
-
83
-
84
-
85
-
86
-
87
-
88
-
89
-
90
-
91
-
92
-
93
-
94
-
95
-
96
-
97
-
98
-
99
-
100
-
101
-
102
-
103
-
104
-
105
-
106
-
107
-
108
-
109
-
110
-
111
-
112
-
113
-
114
-
115
-
116
-
117
-
118
-
119
-
120
-
121
-
122
-
123
-
124
-
125
-
126
-
127
-
128
-
129
-
130
-
131
-
132
-
133
-
134
-
 135
135 -
 136
136 -
 137
137 -
 138
138 -
 139
139 -
 140
140 -
 141
141 -
 142
142 -
 143
143 -
 144
144 -
 145
145 -
 146
146 -
 147
147 -
 148
148 -
 149
149 -
 150
150 -
 151
151 -
 152
152 -
 153
153 -
 154
154
 |
 |

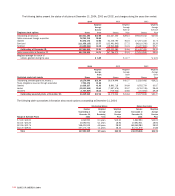
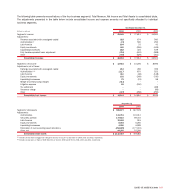
Significant components of the Corporation’s net deferred tax
liability at December 31, 2004 and 2003 are presented in the
following table.
December 31
(Dollars in millions) 2004 2003
Deferred tax liabilities
Equipment lease financing $ 6,192 $5,321
Investments 1,088 905
Intangibles 803 955
Deferred gains and losses 251 189
State income taxes 192 281
Fixed assets 47 246
Employee compensation and
retirement benefits 13 17
Other 435 560
Gross deferred tax liabilities 9,021 8,474
Deferred tax assets
Allowance for credit losses 3,668 2,421
Security valuations 2,326 1,876
Accrued expenses 533 421
Foreign tax credit carryforward 467 –
Available-for-sale securities 146 46
Loan fees and expenses 241 85
Net operating loss carryforwards 91 129
Other 1,150 280
Gross deferred tax assets 8,622 5,258
Valuation allowance(1) (155) (120)
Total deferred tax assets,
net of valuation allowance 8,467 5,138
Net deferred tax liabilities(2) $ 554 $3,336
(1) At December 31, 2004, $70 of the valuation allowance related to gross deferred tax assets
was attributable to the Merger. Future recognition of the tax attributes associated with these
gross deferred tax assets would result in tax benefits being allocated to reduce Goodwill.
(2) The Corporation’s net deferred tax liability was adjusted on April 1, 2004, to include a net
deferred tax asset of $2.0 billion attributable to the Merger.
The valuation allowance recorded by the Corporation at December 31,
2004 and 2003 represents net operating loss carryforwards gener-
ated by foreign subsidiaries and certain state deferred tax assets,
where, in each case, it is more likely than not that realization will not
occur. These net operating loss carryforwards begin to expire after
2005 and could fully expire after 2010.
The foreign tax credit carryforward reflected in the table above
represents foreign income taxes paid that are creditable against
future U.S. income taxes. If not used, these credits begin to expire
after 2009 and could fully expire after 2014.
At December 31, 2004 and 2003, federal income taxes had not
been provided on $1.1 billion and $871 million, respectively, of undis-
tributed earnings of foreign subsidiaries, earned prior to 1987 and
after 1997 that have been reinvested for an indefinite period of time.
If the earnings were distributed, an additional $221 million and $185
million of tax expense, net of credits for foreign taxes paid on such
earnings and for the related foreign withholding taxes, would result in
2004 and 2003, respectively.
On December 21, 2004, the FASB issued FSP No. 109-2 that
provides accounting and disclosure guidance for the foreign earn-
ings repatriation provision within the Act. For additional information
on FSP No. 109-2 and the Act, see Note 1 of the Consolidated
Financial Statements.
Note 18
Fair Value of Financial Instruments
SFAS No. 107, “Disclosures About Fair Value of Financial
Instruments” (SFAS 107), requires the disclosure of the estimated
fair value of financial instruments. The fair value of a financial instru-
ment is the amount at which the instrument could be exchanged in a
current transaction between willing parties, other than in a forced or
liquidation sale. Quoted market prices, if available, are utilized as
estimates of the fair values of financial instruments. Since no quoted
market prices exist for certain of the Corporation’s financial instru-
ments, the fair values of such instruments have been derived based
on management’s assumptions, the estimated amount and timing of
future cash flows and estimated discount rates. The estimation meth-
ods for individual classifications of financial instruments are
described more fully below. Different assumptions could significantly
affect these estimates. Accordingly, the net realizable values could
be materially different from the estimates presented below. In addi-
tion, the estimates are only indicative of the value of individual finan-
cial instruments and should not be considered an indication of the
fair value of the combined Corporation.
The provisions of SFAS 107 do not require the disclosure of the
fair value of lease financing arrangements and nonfinancial instru-
ments, including intangible assets such as goodwill, franchise, and
credit card and trust relationships.
Short-term Financial Instruments
The carrying value of short-term financial instruments, including cash
and cash equivalents, time deposits placed, federal funds sold and
purchased, resale and repurchase agreements, commercial paper
and other short-term investments and borrowings, approximates the
fair value of these instruments. These financial instruments generally
expose the Corporation to limited credit risk and have no stated
maturities or have short-term maturities and carry interest rates that
approximate market.
Financial Instruments Traded in the Secondary Market
Held-to-maturity securities, AFS debt and marketable equity securities,
trading account instruments and long-term debt traded actively in the
secondary market have been valued using quoted market prices. The
fair values of trading account instruments and securities are reported
in Notes 3 and 5 of the Consolidated Financial Statements.
Derivative Financial Instruments
All derivatives are recognized on the Consolidated Balance Sheet at
fair value, net of cash collateral held and taking into consideration
the effects of legally enforceable master netting agreements that
allow the Corporation to settle positive and negative positions with
144 BANK OF AMERICA 2004