Bank of America 2004 Annual Report Download - page 35
Download and view the complete annual report
Please find page 35 of the 2004 Bank of America annual report below. You can navigate through the pages in the report by either clicking on the pages listed below, or by using the keyword search tool below to find specific information within the annual report.-
 1
1 -
2
-
3
-
4
-
5
-
6
-
7
-
8
-
9
-
10
-
11
-
12
-
13
-
14
-
15
-
16
-
17
-
18
-
19
-
20
-
21
-
22
-
23
-
24
-
 25
25 -
 26
26 -
 27
27 -
 28
28 -
 29
29 -
 30
30 -
 31
31 -
 32
32 -
 33
33 -
 34
34 -
 35
35 -
 36
36 -
 37
37 -
 38
38 -
 39
39 -
 40
40 -
 41
41 -
 42
42 -
 43
43 -
 44
44 -
 45
45 -
46
-
47
-
48
-
49
-
50
-
51
-
52
-
53
-
54
-
55
-
56
-
57
-
58
-
59
-
60
-
61
-
62
-
63
-
64
-
65
-
66
-
67
-
68
-
69
-
70
-
71
-
72
-
73
-
74
-
75
-
76
-
77
-
78
-
79
-
80
-
81
-
82
-
83
-
84
-
85
-
86
-
87
-
88
-
89
-
90
-
91
-
92
-
93
-
94
-
95
-
96
-
97
-
98
-
99
-
100
-
101
-
102
-
103
-
104
-
105
-
106
-
107
-
108
-
109
-
110
-
111
-
112
-
113
-
114
-
115
-
116
-
117
-
118
-
119
-
120
-
121
-
122
-
123
-
124
-
125
-
126
-
127
-
128
-
129
-
130
-
131
-
132
-
133
-
134
-
135
-
136
-
137
-
138
-
139
-
140
-
141
-
142
-
143
-
144
-
145
-
146
-
147
-
148
-
149
-
150
-
151
-
152
-
153
-
154
 |
 |

Economic Overview
In 2004, U.S. economic performance was solid, creating a generally
healthy environment for banking, while global growth exceeded
expectations. In the U.S., real Gross Domestic Product (GDP) grew
rapidly, as the negative impact of higher oil prices was more than offset
by sound fundamentals and the FRB's accommodative monetary pol-
icy. Consumer spending continued to rise, while consumer credit qual-
ity remained healthy. Sustained gains in productivity contributed to
rising corporate profits and cash flows. Businesses rebuilt invento-
ries and increased capital spending, particularly for information pro-
cessing equipment and software. Although overall corporate loan
demand remained soft, corporate credit quality improved as the econ-
omy strengthened in the second half of the year. Employment grew
and the unemployment rate receded, although the pace of job cre-
ation was soft relative to GDP growth, reflecting business efforts to
constrain operating costs. Housing activity rose to historic levels.
Inflation rose modestly but stayed low relative to historic standards.
The FRB raised the federal funds rate target from one percent at mid-
year to 2.25 percent, but the increases were widely anticipated and
bond yields remained low, generating a flatter yield curve.
Performance Overview
For the second year in a row, we achieved record earnings. Net
Income totaled $14.1 billion, or $3.69 per diluted common share in
2004, 31 percent and three percent increases, respectively, from
$10.8 billion, or $3.57 per diluted common share in 2003.
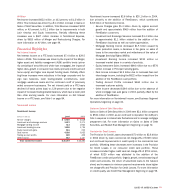
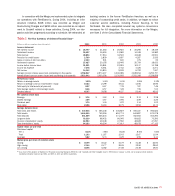
Business Segment Total Revenue and Net Income
Total Revenue Net Income
(Dollars in millions) 2004 2003 2004 2003
Global Consumer and
Small Business Banking $ 26,857 $20,930 $ 6,548 $ 5,706
Global Business and
Financial Services 6,722 4,517 2,833 1,471
Global Capital Markets
and Investment Banking 9,049 8,334 1,950 1,794
Global Wealth and
Investment Management 5,918 4,030 1,584 1,234
All Other 1,064 746 1,228 605
Total FTE basis(1) 49,610 38,557 14,143 10,810
FTE adjustment(1) (716) (643) ––
Total $ 48,894 $37,914 $ 14,143 $ 10,810
(1) Total revenue for the segments and All Other is on a fully taxable-equivalent (FTE) basis. For more
information on a FTE basis, see Supplemental Financial Data beginning on page 38.
Global Consumer and Small Business Banking
Net Income increased $842 million, or 15 percent, to $6.5 billion in
2004, including the $1.1 billion impact of the Merger. Driving this
increase was the $5.2 billion increase in Net Interest Income and a
$1.5 billion increase in Card Income. Partially offsetting this was the
$3.0 billion increase in Noninterest Expense, a $1.7 billion increase
in Provision for Credit Losses and a $1.5 billion decrease in
Mortgage Banking Income. The Provision for Credit Losses increased
$1.7 billion to $3.3 billion, including higher credit card net charge-offs
of $791 million, of which $320 million was attributed to the addition
of the FleetBoston credit card portfolio. For more information on
Global Consumer and Small Business Banking, see page 41.
Global Business and Financial Services
Net Income increased $1.4 billion, or 93 percent, to $2.8 billion for
2004 including the $824 million impact of the addition of FleetBoston.
Both average Loans and Leases, and Deposits grew significantly, with
increases of $36.3 billion, or 39 percent, and $21.6 billion, or 69 percent,
respectively. Impacting these increases were the $29.3 billion
increase in average Loans and Leases and the $17.6 billion increase
in average Deposits related to the addition of FleetBoston. Also driv-
ing the improved results was the $699 million decrease in Provision
for Credit Losses, driven by lower net charge-offs and the continued
credit quality improvement in the commercial portfolio. For more infor-
mation on Global Business and Financial Services, see page 45.
Global Capital Markets and Investment Banking
Net Income increased $156 million, or nine percent, to $2.0 billion in
2004. Contributing to the increase in Net Income was a reduction of
$762 million in the Provision for Credit Losses and increases in
Trading Account Profits and Investment Banking Income of $441 mil-
lion and $147 million, respectively. Notable improvements in credit
quality in the large corporate portfolio and a 71 percent reduction in
net charge-offs drove the $762 million decrease in Provision for
Credit Losses. Partially offsetting these increases were the $460 mil-
lion impact of charges taken for litigation matters in 2004, an
increase of $279 million of incentive compensation for market-based
activities and the $143 million impact of the charges taken for the
mutual fund matter. For more information on Global Capital Markets
and Investment Banking, see page 46.
Global Wealth and Investment Management
Net Income increased $350 million, or 28 percent, to $1.6 billion in
2004. The increase in Net Income was driven by the $253 million
impact of the addition of FleetBoston and growth in both average Loans
and Leases, and Deposits. Total assets under management increased
$154.8 billion, or 52 percent, to $451.5 billion at December 31, 2004,
due to the addition of $148.9 billion of FleetBoston assets under
management and increased market valuation partially offset by
outflows, primarily in money market products. For more information
on Global Wealth and Investment Management, see page 48.
34 BANK OF AMERICA 2004