Bank of America 2004 Annual Report Download - page 43
Download and view the complete annual report
Please find page 43 of the 2004 Bank of America annual report below. You can navigate through the pages in the report by either clicking on the pages listed below, or by using the keyword search tool below to find specific information within the annual report.-
 1
1 -
2
-
3
-
4
-
5
-
6
-
7
-
8
-
9
-
10
-
11
-
12
-
13
-
14
-
15
-
16
-
17
-
18
-
19
-
20
-
21
-
22
-
23
-
24
-
25
-
26
-
27
-
28
-
29
-
30
-
31
-
32
-
 33
33 -
 34
34 -
 35
35 -
 36
36 -
 37
37 -
 38
38 -
 39
39 -
 40
40 -
 41
41 -
 42
42 -
 43
43 -
 44
44 -
 45
45 -
 46
46 -
 47
47 -
 48
48 -
 49
49 -
 50
50 -
 51
51 -
 52
52 -
 53
53 -
54
-
55
-
56
-
57
-
58
-
59
-
60
-
61
-
62
-
63
-
64
-
65
-
66
-
67
-
68
-
69
-
70
-
71
-
72
-
73
-
74
-
75
-
76
-
77
-
78
-
79
-
80
-
81
-
82
-
83
-
84
-
85
-
86
-
87
-
88
-
89
-
90
-
91
-
92
-
93
-
94
-
95
-
96
-
97
-
98
-
99
-
100
-
101
-
102
-
103
-
104
-
105
-
106
-
107
-
108
-
109
-
110
-
111
-
112
-
113
-
114
-
115
-
116
-
117
-
118
-
119
-
120
-
121
-
122
-
123
-
124
-
125
-
126
-
127
-
128
-
129
-
130
-
131
-
132
-
133
-
134
-
135
-
136
-
137
-
138
-
139
-
140
-
141
-
142
-
143
-
144
-
145
-
146
-
147
-
148
-
149
-
150
-
151
-
152
-
153
-
154
 |
 |

42 BANK OF AMERICA 2004
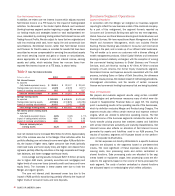
Our extensive network of delivery channels including banking
centers, ATMs, telephone channel and online banking enable us to
provide cost effective, convenient and innovative products to our
customers. Active online banking subscribers increased 73 percent
in 2004. Approximately half of this growth was due to the addition
of FleetBoston.
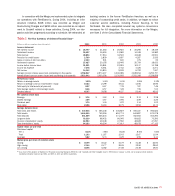
Net Interest Income increased $5.2 billion largely due to the net
effect of the growth in consumer loan and lease, and deposit bal-
ances, and ALM activities. Net Interest Income was positively
impacted by the $44.6 billion, or 48 percent, increase in average
Loans and Leases. This increase was driven by a $15.2 billion, or 54
percent, increase in average on-balance sheet consumer credit card
outstandings, a $14.8 billion, or 83 percent, increase in home equity
lines and a $6.8 billion, or 26 percent, increase in residential mort-
gages. The FleetBoston portfolio accounted for $5.0 billion, $14.0
billion and $10.8 billion of the increases, respectively.
Deposit growth positively impacted Net Interest Income. Higher
consumer deposit balances from the addition of FleetBoston cus-
tomers of $63.1 billion, government tax cuts, higher customer retention
and our focus on adding new customers drove the $74.3 billion, or
31 percent, increase in average Deposits.
Noninterest Income increased $733 million, or eight percent, to
$9.5 billion in 2004. FleetBoston contributed $1.4 billion to
Noninterest Income. Overall, this increase was primarily due to a
$1.5 billion, or 49 percent, increase in Card Income to $4.5 billion
and a $913 million, or 25 percent, increase in Service Charges to
$4.5 billion. Card Income increased mainly due to increases in pur-
chase volumes for both credit and debit cards, and increases in aver-
age managed credit card outstandings. These increases were due to
both the growth of our card businesses, and the addition of the
FleetBoston portfolio. The increase in Service Charges was due pri-
marily to the addition of FleetBoston customers and the growth in
new accounts. Partially offsetting these increases was a $1.5 billion,
or 72 percent, decrease in Mortgage Banking Income to $595 million
and a $186 million decrease in Trading Account Profits to a loss of
$359 million. The decrease in Mortgage Banking Income was due to
decreases in production volume and secondary market sales, com-
bined with the MSR impairments recorded during the second half of the
year. The decrease in Trading Account Profits was due to the negative
impact of faster prepayment speeds and changes in other assumptions
on the value of the Excess Spread Certificates (Certificates) prior
to their conversion to MSRs. For more information on the conversion
of the Certificates into MSRs, see Note 1 of the Consolidated
Financial Statements.
The Provision for Credit Losses increased $1.7 billion to
$3.3 billion, including higher credit card net charge-offs of $791 million,
of which $320 million was attributed to the addition of the
FleetBoston credit card portfolio. Organic growth, overall seasoning of
credit card accounts, the return of securitized loans to the balance
sheet, and increases in minimum payment requirements drove higher
net charge-offs and Provision for Credit Losses. The increase in min-
imum payment requirements is the result of changes in industry prac-
tices and will result in increased charge-offs in 2005. For more
information, see Credit Risk Management beginning on page 58.
Noninterest Expense increased $3.0 billion, or 29 percent.
Driving this increase were increases in Processing Costs of $977 million,
Personnel Expense of $763 million and Other General Operating
Expense of $512 million. Personnel Expense increased as a result of
higher salaries of $537 million and higher benefit costs of $185 million.
The impact of the addition of FleetBoston to Noninterest Expense
was $1.9 billion, including $538 million of Personnel Expense and
$443 million of Data Processing Costs.
Across the three major businesses within Global Consumer and
Small Business Banking, our most significant product lines are Card
Services, Consumer Real Estate and Consumer Deposit Products.
Card Services
Card Services provides a broad offering of credit cards to an array of
customers including consumers and small businesses. Our products
include traditional credit cards, a variety of co-branded and affinity
card products, as well as purchasing, and travel and entertainment
card products. We also provide processing services for merchant
card receipts, a business where we are a market leader, due in part
to our acquisition of NPC during the fourth quarter of 2004.
We evaluate our Card Services business on both a held and
managed basis. Managed card revenue excludes the impact of card
securitization activity, which is used as a financing tool. On a held
basis, for assets that have been securitized, we record Noninterest
Income, rather than Net Interest Income and Provision for Credit
Losses, as we are compensated for servicing income and gains or
losses on securitizations. Managed card revenue excludes the impact
of the securitized credit card portfolio of $134 million and $7 million
for 2004 and 2003, respectively. These amounts are the result of the
differences in internal and external funding costs as well as the amor-
tization of previously recognized securitization gains. After the revolv-
ing period of the securitizations, the card receivables will return to our
Balance Sheet. This has the effect of increasing Loans and Leases on
our Balance Sheet and increasing Net Interest Income and the
Provision for Credit Losses, with a reduction in Noninterest Income.