Bank of America 2004 Annual Report Download - page 55
Download and view the complete annual report
Please find page 55 of the 2004 Bank of America annual report below. You can navigate through the pages in the report by either clicking on the pages listed below, or by using the keyword search tool below to find specific information within the annual report.-
 1
1 -
2
-
3
-
4
-
5
-
6
-
7
-
8
-
9
-
10
-
11
-
12
-
13
-
14
-
15
-
16
-
17
-
18
-
19
-
20
-
21
-
22
-
23
-
24
-
25
-
26
-
27
-
28
-
29
-
30
-
31
-
32
-
33
-
34
-
35
-
36
-
37
-
38
-
39
-
40
-
41
-
42
-
43
-
44
-
 45
45 -
 46
46 -
 47
47 -
 48
48 -
 49
49 -
 50
50 -
 51
51 -
 52
52 -
 53
53 -
 54
54 -
 55
55 -
 56
56 -
 57
57 -
 58
58 -
 59
59 -
 60
60 -
 61
61 -
 62
62 -
 63
63 -
 64
64 -
 65
65 -
66
-
67
-
68
-
69
-
70
-
71
-
72
-
73
-
74
-
75
-
76
-
77
-
78
-
79
-
80
-
81
-
82
-
83
-
84
-
85
-
86
-
87
-
88
-
89
-
90
-
91
-
92
-
93
-
94
-
95
-
96
-
97
-
98
-
99
-
100
-
101
-
102
-
103
-
104
-
105
-
106
-
107
-
108
-
109
-
110
-
111
-
112
-
113
-
114
-
115
-
116
-
117
-
118
-
119
-
120
-
121
-
122
-
123
-
124
-
125
-
126
-
127
-
128
-
129
-
130
-
131
-
132
-
133
-
134
-
135
-
136
-
137
-
138
-
139
-
140
-
141
-
142
-
143
-
144
-
145
-
146
-
147
-
148
-
149
-
150
-
151
-
152
-
153
-
154
 |
 |

54 BANK OF AMERICA 2004
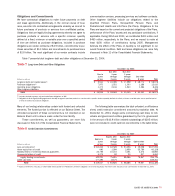
Estate are frequently distributed in the secondary market. In connection
with our balance sheet management activities, we may retain mortgage
loans originated as well as purchase and sell loans based on our
assessment of market conditions.
Deposits and Other Funding Sources
Deposits are a key source of funding. Table
I
on page 84 provides
information on the average amounts of deposits and the rates paid
by deposit category. Average Deposits increased $145.3 billion to
$551.6 billion due to a $97.9 billion increase in average domestic
interest-bearing deposits, a $31.1 billion increase in average nonin-
terest-bearing deposits and a $16.3 billion increase in average
foreign interest-bearing deposits. These increases included the
$71.0 billion, $25.3 billion and $5.5 billion impact of the addition of
FleetBoston domestic interest-bearing deposits, noninterest-bearing
deposits and foreign interest-bearing deposits, respectively. We
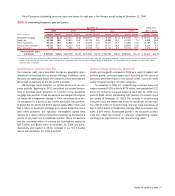
categorize our deposits into either core or market-based deposits.
Core deposits, which are generally customer-based, are an important
stable, low-cost funding source and typically react more slowly to
interest rate changes than market-based deposits. Core deposits
exclude negotiable CDs, public funds, other domestic time deposits
and foreign interest-bearing deposits. Average core deposits
increased $130.7 billion to $494.1 billion, a 36 percent increase
from a year ago, which included $95.6 billion in average core
deposits from the addition of FleetBoston. The increase was distrib-
uted between NOW and money market deposits, noninterest-bearing
deposits, consumer CDs and IRAs, and savings. Average market-
based deposit funding increased $14.6 billion to $57.5 billion. The
increase was due to a $16.3 billion increase in foreign interest-bearing
deposits offset by a $1.7 billion decrease in negotiable CDs, public
funds and other domestic time deposits. These increases also
reflected the $6.2 billion impact to average market-based deposit
funding from the addition of FleetBoston market-based deposit fund-
ing. Deposits, on average, represented 53 percent and 54 percent of
total sources of funds in 2004 and 2003, respectively.
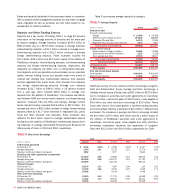
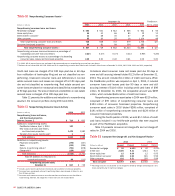
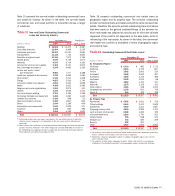
Table 5 summarizes average deposits by category.
Table 5
Average Deposits
(Dollars in millions) 2004 2003
Deposits by type
Domestic interest-bearing:
Savings $ 33,959 $ 24,538
NOW and money market accounts 214,542 148,896
Consumer CDs and IRAs 94,770 70,246
Negotiable CDs and other time deposits 5,977 7,627
Total domestic interest-bearing 349,248 251,307
Foreign interest-bearing:
Banks located in foreign countries 18,426 13,959
Governments and official institutions 5,327 2,218
Time, savings and other 27,739 19,027
Total foreign interest-bearing 51,492 35,204
Total interest-bearing 400,740 286,511
Noninterest-bearing 150,819 119,722
Total deposits $ 551,559 $ 406,233
Core and market-based deposits
Core deposits $ 494,090 $ 363,402
Market-based deposits 57,469 42,831
Total deposits $ 551,559 $ 406,233
Additional sources of funds include short-term borrowings, Long-term
Debt and Shareholders’ Equity. Average short-term borrowings, a
relatively low-cost source of funds, were up $87.1 billion to $227.6 billion
due to increases in securities sold under agreements to repurchase
of $59.4 billion, commercial paper of $18.2 billion, notes payable of
$8.6 billion and other short-term borrowings of $2.9 billion. These
funds were used to fund asset growth or facilitate trading activities
and were partially offset by a decrease of $2.0 billion in federal funds
purchased. The increases in average short-term borrowings included
the $4.0 billion, $274 million, $18 million, and $1.1 billion impact of
the addition of FleetBoston securities sold under agreements to
repurchase, commercial paper, notes payable and other short-term
borrowings, respectively. Issuances and repayments of Long-term
Debt were $21.3 billion and $16.9 billion, respectively, for 2004.
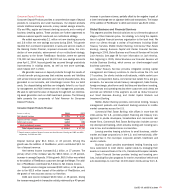
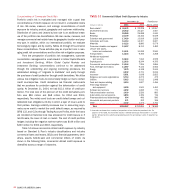
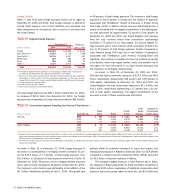
Table 6
Short–term Borrowings
2004 2003 2002
(Dollars in millions) Amount Rate Amount Rate Amount Rate
Federal funds purchased
At December 31 $ 3,108 2.32% $ 2,356 0.84% $ 5,167 1.15%
Average during year 3,724 1.31 5,736 1.10 5,470 1.63
Maximum month-end balance during year 7,852 – 7,877 – 9,663 –
Securities sold under agreements to repurchase
At December 31 116,633 2.85 75,690 1.12 59,912 1.44
Average during year 161,494 2.08 102,074 1.15 67,751 1.73
Maximum month-end balance during year 191,899 – 124,746 – 99,313 –
Commercial paper
At December 31 25,379 1.71 7,605 1.09 114 1.20
Average during year 21,178 1.45 2,976 1.29 1,025 1.73
Maximum month-end balance during year 26,486 – 9,136 – 1,946 –
Other short-term borrowings
At December 31 53,219 2.49 27,375 1.98 16,599 1.29
Average during year 41,162 1.73 29,672 2.02 24,231 2.90
Maximum month-end balance during year 53,756 – 46,635 – 33,549 –