Bank of America 2004 Annual Report Download - page 115
Download and view the complete annual report
Please find page 115 of the 2004 Bank of America annual report below. You can navigate through the pages in the report by either clicking on the pages listed below, or by using the keyword search tool below to find specific information within the annual report.-
 1
1 -
2
-
3
-
4
-
5
-
6
-
7
-
8
-
9
-
10
-
11
-
12
-
13
-
14
-
15
-
16
-
17
-
18
-
19
-
20
-
21
-
22
-
23
-
24
-
25
-
26
-
27
-
28
-
29
-
30
-
31
-
32
-
33
-
34
-
35
-
36
-
37
-
38
-
39
-
40
-
41
-
42
-
43
-
44
-
45
-
46
-
47
-
48
-
49
-
50
-
51
-
52
-
53
-
54
-
55
-
56
-
57
-
58
-
59
-
60
-
61
-
62
-
63
-
64
-
65
-
66
-
67
-
68
-
69
-
70
-
71
-
72
-
73
-
74
-
75
-
76
-
77
-
78
-
79
-
80
-
81
-
82
-
83
-
84
-
85
-
86
-
87
-
88
-
89
-
90
-
91
-
92
-
93
-
94
-
95
-
96
-
97
-
98
-
99
-
100
-
101
-
102
-
103
-
104
-
 105
105 -
 106
106 -
 107
107 -
 108
108 -
 109
109 -
 110
110 -
 111
111 -
 112
112 -
 113
113 -
 114
114 -
 115
115 -
 116
116 -
 117
117 -
 118
118 -
 119
119 -
 120
120 -
 121
121 -
 122
122 -
 123
123 -
 124
124 -
 125
125 -
126
-
127
-
128
-
129
-
130
-
131
-
132
-
133
-
134
-
135
-
136
-
137
-
138
-
139
-
140
-
141
-
142
-
143
-
144
-
145
-
146
-
147
-
148
-
149
-
150
-
151
-
152
-
153
-
154
 |
 |

114 BANK OF AMERICA 2004
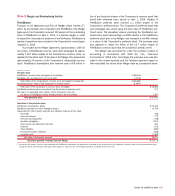
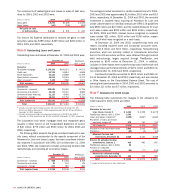
Note 5
Securities
The amortized cost, gross unrealized gains and losses, and fair value of AFS debt and marketable equity securities, and Held-to-maturity
Securities at December 31, 2004, 2003 and 2002 were:
Gross Gross
Amortized Unrealized Unrealized Fair
(Dollars in millions) Cost Gains Losses Value
Available-for-sale securities
2004
U.S. Treasury securities and agency debentures $ 826 $ – $ 1 $ 825
Mortgage-backed securities 173,697 174 624 173,247
Foreign sovereign securities 7,437 36 26 7,447
Other taxable securities 9,493 – 13 9,480
Total taxable 191,453 210 664 190,999
Tax-exempt securities 3,662 87 5 3,744
Total available-for-sale securities $195,115 $ 297 $ 669 $194,743
Available-for-sale marketable equity securities(1) $ 3,571 $ 32 $ 2 $ 3,601
2003
U.S. Treasury securities and agency debentures $ 710 $ 5 $ 2 $ 713
Mortgage-backed securities 56,403 63 575 55,891
Foreign sovereign securities 2,816 23 38 2,801
Other taxable securities 4,765 36 69 4,732
Total taxable 64,694 127 684 64,137
Tax-exempt securities 2,167 79 1 2,245
Total available-for-sale securities $ 66,861 $ 206 $ 685 $ 66,382
Available-for-sale marketable equity securities(1) $ 2,803 $ 394 $ 31 $ 3,166
2002
U.S. Treasury securities and agency debentures $ 691 $ 20 $ – $ 711
Mortgage-backed securities 58,813 847 5 59,655
Foreign sovereign securities 2,235 30 103 2,162
Other taxable securities 1,095 25 38 1,082
Total taxable 62,834 922 146 63,610
Tax-exempt securities 2,824 96 4 2,916
Total available-for-sale securities $ 65,658 $1,018 $ 150 $ 66,526
Available-for-sale marketable equity securities(1) $ 2,761 $ 19 $ 127 $ 2,653
Held-to-maturity securities
2004
Taxable securities $41 $4 $4 $41
Tax-exempt securities 289 – 1 288
Total held-to-maturity securities $ 330 $ 4 $ 5 $ 329
2003
Mortgage-backed securities $ 1 $ – $ – $ 1
Foreign sovereign securities 49 – 3 46
Other taxable securities 46 3 – 49
Total taxable 96 3 3 96
Tax-exempt securities 151 7 – 158
Total held-to-maturity securities $ 247 $ 10 $ 3 $ 254
2002
Mortgage-backed securities $ 3 $ – $ – $ 3
Foreign sovereign securities 788 10 49 749
Other taxable securities 45 4 – 49
Total taxable 836 14 49 801
Tax-exempt securities 190 10 – 200
Total held-to-maturity securities $ 1,026 $ 24 $ 49 $ 1,001
(1) Represents those AFS marketable equity securities that are recorded in Other Assets on the Consolidated Balance Sheet.
At December 31, 2004, accumulated net unrealized losses on AFS
debt and marketable equity securities included in Shareholders’
Equity were $196 million, net of the related income tax benefit of
$146 million. At December 31, 2003, accumulated net unrealized
losses on these securities were $70 million, net of the related
income tax benefit of $46 million.
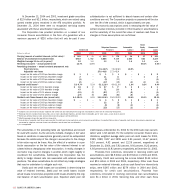
The following table presents the current fair value and the
associated unrealized losses only on investments in securities with
unrealized losses at December 31, 2004. Unrealized losses on