Bank of America 2004 Annual Report Download - page 151
Download and view the complete annual report
Please find page 151 of the 2004 Bank of America annual report below. You can navigate through the pages in the report by either clicking on the pages listed below, or by using the keyword search tool below to find specific information within the annual report.-
 1
1 -
2
-
3
-
4
-
5
-
6
-
7
-
8
-
9
-
10
-
11
-
12
-
13
-
14
-
15
-
16
-
17
-
18
-
19
-
20
-
21
-
22
-
23
-
24
-
25
-
26
-
27
-
28
-
29
-
30
-
31
-
32
-
33
-
34
-
35
-
36
-
37
-
38
-
39
-
40
-
41
-
42
-
43
-
44
-
45
-
46
-
47
-
48
-
49
-
50
-
51
-
52
-
53
-
54
-
55
-
56
-
57
-
58
-
59
-
60
-
61
-
62
-
63
-
64
-
65
-
66
-
67
-
68
-
69
-
70
-
71
-
72
-
73
-
74
-
75
-
76
-
77
-
78
-
79
-
80
-
81
-
82
-
83
-
84
-
85
-
86
-
87
-
88
-
89
-
90
-
91
-
92
-
93
-
94
-
95
-
96
-
97
-
98
-
99
-
100
-
101
-
102
-
103
-
104
-
105
-
106
-
107
-
108
-
109
-
110
-
111
-
112
-
113
-
114
-
115
-
116
-
117
-
118
-
119
-
120
-
121
-
122
-
123
-
124
-
125
-
126
-
127
-
128
-
129
-
130
-
131
-
132
-
133
-
134
-
135
-
136
-
137
-
138
-
139
-
140
-
 141
141 -
 142
142 -
 143
143 -
 144
144 -
 145
145 -
 146
146 -
 147
147 -
 148
148 -
 149
149 -
 150
150 -
 151
151 -
 152
152 -
 153
153 -
 154
154
 |
 |

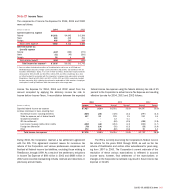
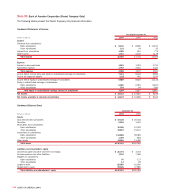
Note 21
Performance by Geographic Area
Since the Corporation’s operations are highly integrated, certain asset, liability, income and expense amounts must be allocated to arrive at
Total Assets, Total Revenue, Income (Loss) Before Income Taxes and Net Income (Loss) by geographic area. The Corporation identifies its
geographic performance based upon the business unit structure used to manage the capital or expense deployed in the region, as applicable.
This requires certain judgments related to the allocation of revenue so that revenue can be appropriately matched with the related expense or
capital deployed in the region.
At December 31 Year Ended December 31
Income (Loss) Net
Total Total Before Income
(Dollars in millions) Year Assets(1) Revenue(2) Income Taxes (Loss)
Domestic(3) 2004 $ 1,046,639 $ 46,156 $ 20,072 $ 13,384
2003 672,834 36,541 15,955 10,843
2002 32,884 13,537 9,548
Asia 2004 21,658 708 330 237
2003 20,016 414 82 71
2002 639 218 157
Europe, Middle East and Africa 2004 27,536 1,136 353 234
2003 23,858 847 (14) (1)
2002 838 (367) (210)
Latin America and the Caribbean 2004 14,624 894 466 288
2003 2,775 112 (162) (103)
2002 142 (397) (246)
Total Foreign 2004 63,818 2,738 1,149 759
2003 46,649 1,373 (94) (33)
2002 1,619 (546) (299)
Total Consolidated 2004 $ 1,110,457 $ 48,894 $ 21,221 $ 14,143
2003 719,483 37,914 15,861 10,810
2002 34,503 12,991 9,249
(1) Total Assets includes long-lived assets, which are primarily located in the U.S.
(2) There were no material intercompany revenues between geographic regions for any of the periods presented.
(3) Includes the Corporation’s Canadian operations, which had Total Assets of $4,849 and $2,799 at December 31, 2004 and 2003, respectively; Total Revenue of $88, $96 and $96; Income before
Income Taxes of $49, $60 and $111; and Net Income of $41, $12 and $83 for the years ended December 31, 2004, 2003 and 2002, respectively.
150 BANK OF AMERICA 2004