Bank of America 2004 Annual Report Download - page 65
Download and view the complete annual report
Please find page 65 of the 2004 Bank of America annual report below. You can navigate through the pages in the report by either clicking on the pages listed below, or by using the keyword search tool below to find specific information within the annual report.-
 1
1 -
2
-
3
-
4
-
5
-
6
-
7
-
8
-
9
-
10
-
11
-
12
-
13
-
14
-
15
-
16
-
17
-
18
-
19
-
20
-
21
-
22
-
23
-
24
-
25
-
26
-
27
-
28
-
29
-
30
-
31
-
32
-
33
-
34
-
35
-
36
-
37
-
38
-
39
-
40
-
41
-
42
-
43
-
44
-
45
-
46
-
47
-
48
-
49
-
50
-
51
-
52
-
53
-
54
-
 55
55 -
 56
56 -
 57
57 -
 58
58 -
 59
59 -
 60
60 -
 61
61 -
 62
62 -
 63
63 -
 64
64 -
 65
65 -
 66
66 -
 67
67 -
 68
68 -
 69
69 -
 70
70 -
 71
71 -
 72
72 -
 73
73 -
 74
74 -
 75
75 -
76
-
77
-
78
-
79
-
80
-
81
-
82
-
83
-
84
-
85
-
86
-
87
-
88
-
89
-
90
-
91
-
92
-
93
-
94
-
95
-
96
-
97
-
98
-
99
-
100
-
101
-
102
-
103
-
104
-
105
-
106
-
107
-
108
-
109
-
110
-
111
-
112
-
113
-
114
-
115
-
116
-
117
-
118
-
119
-
120
-
121
-
122
-
123
-
124
-
125
-
126
-
127
-
128
-
129
-
130
-
131
-
132
-
133
-
134
-
135
-
136
-
137
-
138
-
139
-
140
-
141
-
142
-
143
-
144
-
145
-
146
-
147
-
148
-
149
-
150
-
151
-
152
-
153
-
154
 |
 |

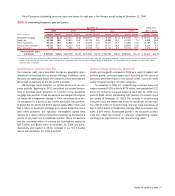
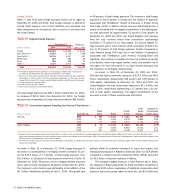
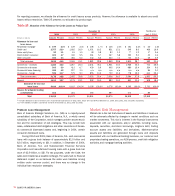
As shown in Table 19, at December 31, 2004, foreign exposure to
borrowers or counterparties in emerging markets increased 42 per-
cent to $15.5 billion, or 17 percent, of total foreign exposure, from
$10.9 billion, or 18 percent of total exposure at the end of 2003. At
December 31, 2004, 58 percent, of the emerging markets exposure
was in Latin America compared to 42 percent at December 31, 2003.
The increase in Latin America was attributable to the addition of the
$6.7 billion FleetBoston portfolio on April 1, 2004. This growth was
partially offset by continued reductions in Loans and Leases, and
trading activity exposure in Argentina, Brazil and Chile. Our 24.9 percent
investment in Grupo Financiero Santander Serfin (GFSS) accounted
for $1.9 billion of reported exposure in Mexico.
The company’s largest exposure in Latin America was in Brazil.
Our exposure in Brazil at December 31, 2004 and 2003, included $1.4
billion and $331 million, respectively, of traditional cross-border credit
exposure (Loans and Leases, letters of credit, etc.), and $1.8 billion and
64 BANK OF AMERICA 2004
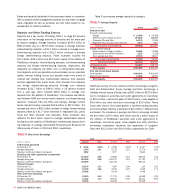
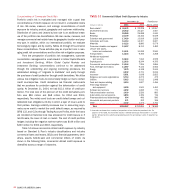
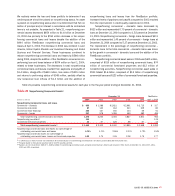
Foreign Portfolio
Table 17 sets forth total foreign exposure broken out by region at
December 31, 2004 and 2003. Total foreign exposure is defined to
include credit exposure, net of local liabilities, plus securities and
other investments for all exposure with a country of risk other than
the United States.
Table 17
Regional Foreign Exposure(1)
December 31 FleetBoston
■■■■■
(Dollars in millions) 2004 2003 April 1, 2004
■■■■■
Europe $62,428 $39,496 $ 5,003
Latin America(2,3) 10,823 5,791 7,568
Asia Pacific(2,4) 10,736 9,547 443
Middle East 527 584 82
Africa 238 108 41
Other(5) 5,327 4,374 865
■■■■■
Total $90,079 $59,900 $14,002
■■■■■
(1) The balances above reflect the subtraction of local funding or liabilities from local exposures
as allowed by the Federal Financial Institutions Examination Council (FFIEC).
(2) Exposures for Latin America and Asia Pacific have been reduced by $196 and $14, respectively,
at December 31, 2004, and $173 and $13, respectively, at December 31, 2003. Such amounts
represent the fair value of U.S. Treasury securities held as collateral outside the country of exposure.
(3) Includes Bermuda and Cayman Islands.
(4) Includes Australia and New Zealand.
(5) Other includes Canada and supranational entities.
Our total foreign exposure was $90.1 billion at December 31, 2004,
an increase of $30.2 billion from December 31, 2003. Our foreign
exposure was concentrated in Europe, which accounted for $62.4 billion,
or 69 percent, of total foreign exposure. The increase in total foreign
exposure is due to growth in Europe and the addition of exposure
associated with FleetBoston. Growth of exposure in Europe during
2004 was mostly in Western Europe and was distributed across a
variety of industries with the largest concentration in the banking sec-
tor that accounted for approximately 53 percent of the growth. At
December 31, 2004 and 2003, the United Kingdom and Germany
were the only countries whose total cross-border outstandings
exceeded 0.75 percent of our total assets. Our second largest for-
eign exposure was in Latin America, which accounted for $10.8 bil-
lion, or 12 percent, of total foreign exposure. Growth of exposure in
Latin America during 2004 was due to the addition of operations
associated with FleetBoston. Latin America, including Brazil and
Argentina, may continue to experience economic, political and social
uncertainties, which may impact market, credit, and transfer risk of
this region. For more information on our Latin America exposure, see
the discussion of emerging markets below.
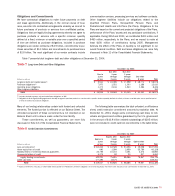
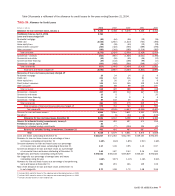
As shown in Table 18, at December 31, 2004 and 2003,
Germany had total cross-border exposure of $12.0 billion and $6.9
billion, respectively, representing 1.08 percent and 0.95 percent of
total assets, respectively. At December 31, 2004 and 2003, the
United Kingdom had total cross-border exposure of $11.9 billion and
$10.1 billion, respectively, representing 1.07 percent and 1.41 per-
cent of total assets, respectively. The largest concentration of the
exposure to both of these countries was with banks.
Table 18
Cross–border Exposure Exceeding One Percent of Total Assets(1,2)
Cross- Exposure as
Public Private border a Percentage
(Dollars in millions) December 31 Sector Banks Sector Exposure of Total Assets
Germany 2004 $ 659 $ 6,251 $ 5,081 $11,991 1.08%
2003 441 3,436 2,978 6,855 0.95
2002 334 2,898 2,534 5,766 0.89
United Kingdom 2004 $ 74 $ 3,239 $ 8,606 $11,919 1.07%
2003 143 3,426 6,552 10,121 1.41
2002 167 2,492 6,758 9,417 1.46
(1) Exposure includes cross-border claims by our foreign offices as follows: loans, accrued interest receivable, acceptances, time deposits placed, trading account assets, securities, derivative assets,
other interest-earning investments and other monetary assets. Amounts also include unused commitments, SBLCs, commercial letters of credit and formal guarantees. Sector definitions are based on the
FFIEC instructions for preparing the Country Exposure Report.
(2) The total cross-border exposure for Germany and United Kingdom at December 31, 2004 includes derivatives exposure of $3,641 and $2,564, respectively, against which we hold collateral totaling $1,477
and $1,788, respectively.