Bank of America 2004 Annual Report Download - page 84
Download and view the complete annual report
Please find page 84 of the 2004 Bank of America annual report below. You can navigate through the pages in the report by either clicking on the pages listed below, or by using the keyword search tool below to find specific information within the annual report.-
 1
1 -
2
-
3
-
4
-
5
-
6
-
7
-
8
-
9
-
10
-
11
-
12
-
13
-
14
-
15
-
16
-
17
-
18
-
19
-
20
-
21
-
22
-
23
-
24
-
25
-
26
-
27
-
28
-
29
-
30
-
31
-
32
-
33
-
34
-
35
-
36
-
37
-
38
-
39
-
40
-
41
-
42
-
43
-
44
-
45
-
46
-
47
-
48
-
49
-
50
-
51
-
52
-
53
-
54
-
55
-
56
-
57
-
58
-
59
-
60
-
61
-
62
-
63
-
64
-
65
-
66
-
67
-
68
-
69
-
70
-
71
-
72
-
73
-
 74
74 -
 75
75 -
 76
76 -
 77
77 -
 78
78 -
 79
79 -
 80
80 -
 81
81 -
 82
82 -
 83
83 -
 84
84 -
 85
85 -
 86
86 -
 87
87 -
 88
88 -
 89
89 -
 90
90 -
 91
91 -
 92
92 -
 93
93 -
 94
94 -
95
-
96
-
97
-
98
-
99
-
100
-
101
-
102
-
103
-
104
-
105
-
106
-
107
-
108
-
109
-
110
-
111
-
112
-
113
-
114
-
115
-
116
-
117
-
118
-
119
-
120
-
121
-
122
-
123
-
124
-
125
-
126
-
127
-
128
-
129
-
130
-
131
-
132
-
133
-
134
-
135
-
136
-
137
-
138
-
139
-
140
-
141
-
142
-
143
-
144
-
145
-
146
-
147
-
148
-
149
-
150
-
151
-
152
-
153
-
154
 |
 |

BANK OF AMERICA 2004 83
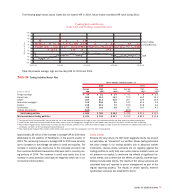
Global Capital Markets and Investment Banking
Total Revenue increased $133 million, or two percent, in 2003
compared to 2002 driven by an increase in Noninterest Income. Net
Interest Income remained relatively flat at $4.3 billion as average
Loans and Leases declined $12.0 billion, or 25 percent and average
Deposits increased $1.4 billion, or two percent. Noninterest Income
increased $189 million, or five percent, resulting from increases in
Investment Banking Income, Service Charges, Investment and
Brokerage Services, and Equity Investment Gains offset by declines
in Trading Account Profits. In 2003, Net Income increased $192 million,
or 12 percent, due to the increase in Noninterest Income and lower
Provision for Credit Losses offset by an increase in Noninterest
Expense. Provision for Credit Losses declined $465 million to $303
million due to continued improvements in credit quality. Noninterest
Expense increased by $402 million, or eight percent, driven by costs
associated with downsizing operations in South America and Asia
and restructuring locations outside the U.S., higher market-based
compensation, increases in litigation expenses and reserves, and the
allocation of the charge related to issues surrounding our mutual
fund practices.
Global Wealth and Investment Management
Total Revenue increased $401 million, or 11 percent, in 2003. Net
Interest Income remained relatively flat as growth in Deposits and
increased loan spreads were offset by the net results of ALM activi-
ties. Noninterest Income increased $372 million, or 22 percent, an
increase in Equity Investment Gains of $198 million related to gains
from securities sold that were received in satisfaction of debt that
had been restructured and charged off in prior periods, and higher
asset management fees. Net Income increased $351 million, or 40
percent. This increase was due to the increase in Noninterest Income
and lower Provision for Credit Losses. Provision for Credit Losses
decreased $309 million, driven by one large charge-off recorded in
2002. The allocation of the charge related to issues surrounding our
mutual fund practices and increased expenses associated with the
addition of financial advisors were the drivers of the $182 million, or
nine percent, increase in Noninterest Expense.
All Other
In 2003 compared to 2002, Total Revenue in Latin America
decreased $10 million, or 24 percent. Net Interest Income decreased
$11 million, or 31 percent, due to lower Loan and Lease balances.
Noninterest Income remained relatively unchanged at $9 million.
Provision for Credit Losses decreased $155 million, or 64 percent,
due to continued improvement in credit quality and Noninterest
Expense increased $12 million. As a result, Net Loss in Latin America
improved $100 million or 68 percent. Total Revenue in Equity
Investments increased $190 million, or 43 percent, in 2003 com-
pared to 2002 due to an improvement in Equity Investment Gains.
Equity Investments had a Net Loss of $249 million in 2003 compared
to a Net Loss of $330 million in 2002. In 2003, Principal Investing
recorded cash gains of $273 million and fair value adjustment gains
of $47 million, offset by impairment charges of $438 million.
Noninterest Income primarily consists of Equity Investment Gains
(Losses). Total Revenue in Other increased $38 million, or four per-
cent, in 2003 compared to 2002. Net Income decreased $147 mil-
lion, or 14 percent. Net Interest Income remained relatively flat.
Noninterest Income increased $35 million resulting from increases in
gains on whole mortgage loan sales. Gains on Sales of Debt
Securities increased $235 million to $942 million in 2003, as we
continued to reposition the ALM portfolio in response to changes in
interest rates. Noninterest Expense increased $132 million, or 39
percent.